Int. J. Dev. Biol. 69: 61 - 69 (2025)
Tension-induced enhancement of SIX1 expression during preplacodal ectoderm differentiation from human induced pluripotent stem cells
Open Access | Original Article | Published: 13 June 2025
Abstract
Based on observations of in vivo morphogenesis, differentiation is expected to be regulated by mechanical cues. However, the detail mechanisms remain largely unknown. A previous study using human pluripotent stem cells (hPSCs) demonstrated that neural plate border (NPB) specification was enhanced by mechanical force. However, it is unknown whether mechanical force is also involved in the specification of the preplacodal ectoderm (PPE), which is derived from the NPB. Here, we verified the validity of the PPE induction method in stretch chambers, and conducted the stretching stimuli experiments. When repetitive stretching stimuli were applied from Day 2 to 10 or Day 2 to 7, expression of the PPE marker SIX1 was increased. However, this increase was not observed when the stimuli were applied from Day 5 to 10, suggesting there is a critical period of sensitivity to mechanical forces. Immunofluorescent staining revealed lower active β-catenin signals in the cell sheet in the stretched samples compared to those in the controls, suggesting a negative correlation between stretching stimuli and Wnt signaling. Our finding suggests that mechanical force is important in PPE differentiation.
Keywords
preplacodal ectoderm, SIX1, mechanical force, induced pluripotent stem cells, β-catenin
Introduction
Morphogens, such as bone morphogenetic protein (BMP), Wnt, and fibroblast growth factor (FGF), are important for tissue patterning (Rogers and Schier, 2011). Based on the BMP gradient, the ectoderm differentiates into the neural plate (NP), non-neural ectoderm (NNE), and neural plate border (NPB) between the NP and NNE: low level for NP, high level for NNE, and intermediate level for NPB (Rogers et al., 2009; Stern, 2005). NPB gives rise to the neural crest (NC) and preplacodal ectoderm (PPE), which requires at least three signaling pathways: high levels of FGF and Wnt, and low level of BMP for NC; and intermediate levels of FGF and BMP, and low level of Wnt for PPE formation (Griffin and Saint-Jeannet, 2024; Groves and LaBonne, 2014; Nat, 2016; Simões-Costa and Bronner, 2015; Singh and Groves, 2016; Tsukano et al., 2022).
Mechanical cues also contribute to the patterning (Alvarez and Smutny, 2022; Davidson, 2017). For instance, during pre-implantation development in mice, high contractility of blastomeres specifies the fate of the trophectoderm, whereas low contractility specifies the inner cell mass (Maître et al., 2016). In Xenopus embryos, mechanical force affects mesenchymal-to-epithelial transition during heart progenitor development (Jackson et al., 2017), and specification of the neural crest (NC) (Alasaadi et al., 2024; Kaneshima et al., 2024). In the early neurulation process of amniotes, the closure of the NP is expected to generate tension in the adjacent NPB region (Supplementary Fig. 1). Indeed, studies using Xenopus embryos showed that young’s modulus, which reflects the surface tension, ranging from neural plate to lateral ectoderm during neurulation, decreases laterally (Kaneshima et al., 2024). However, the involvement of mechanical cues in human embryonic development remains largely unknown, partly because research using human embryos is restricted due to ethical issues. Alternatively, human pluripotent stem cells (hPSCs) are useful for analyzing human embryogenesis in vitro (Ávila-González et al., 2023; Liu et al., 2020).
A recent study using hPSCs demonstrated that the stretching force during NP differentiation enhanced NPB differentiation (Xue et al., 2018). NPB is a precursor of PPE, therefore, we hypothesized that mechanical force is also involved in PPE specification. In this study, we investigated the effect of stretching stimuli with two parameters: stretch rate and timing of the stimuli. Using silicone chambers made of polydimethylsiloxane (PDMS) during the differentiation, we examined whether PPE differentiation is influenced by mechanical force.
Results
Induction protocol to neuroectodermal cells including PPE from human induced pluripotent stem cells (hiPSCs) on stretch chamber
We firstly checked whether PPE differentiation was valid in PDMS chambers before applying stretching stimuli. We combined the two PPE induction protocols used for hiPSCs in plastic chambers (Dincer et al., 2013; Nihei et al., 2013) (Fig. 1A). Unfortunately, the cells peeled off when stretched (data not shown). To resolve this problem and enhance PPE differentiation, basic fibroblast growth factor (bFGF) was added to KnockOut™ Serum Replacement (KSR) medium (Tchieu et al., 2017). In addition, the chambers were hydrophilized using UV irradiation to improve the efficiency of the Matrigel coating (Efimenko et al., 2002; Gokaltun et al., 2017; Zhou et al., 2012).
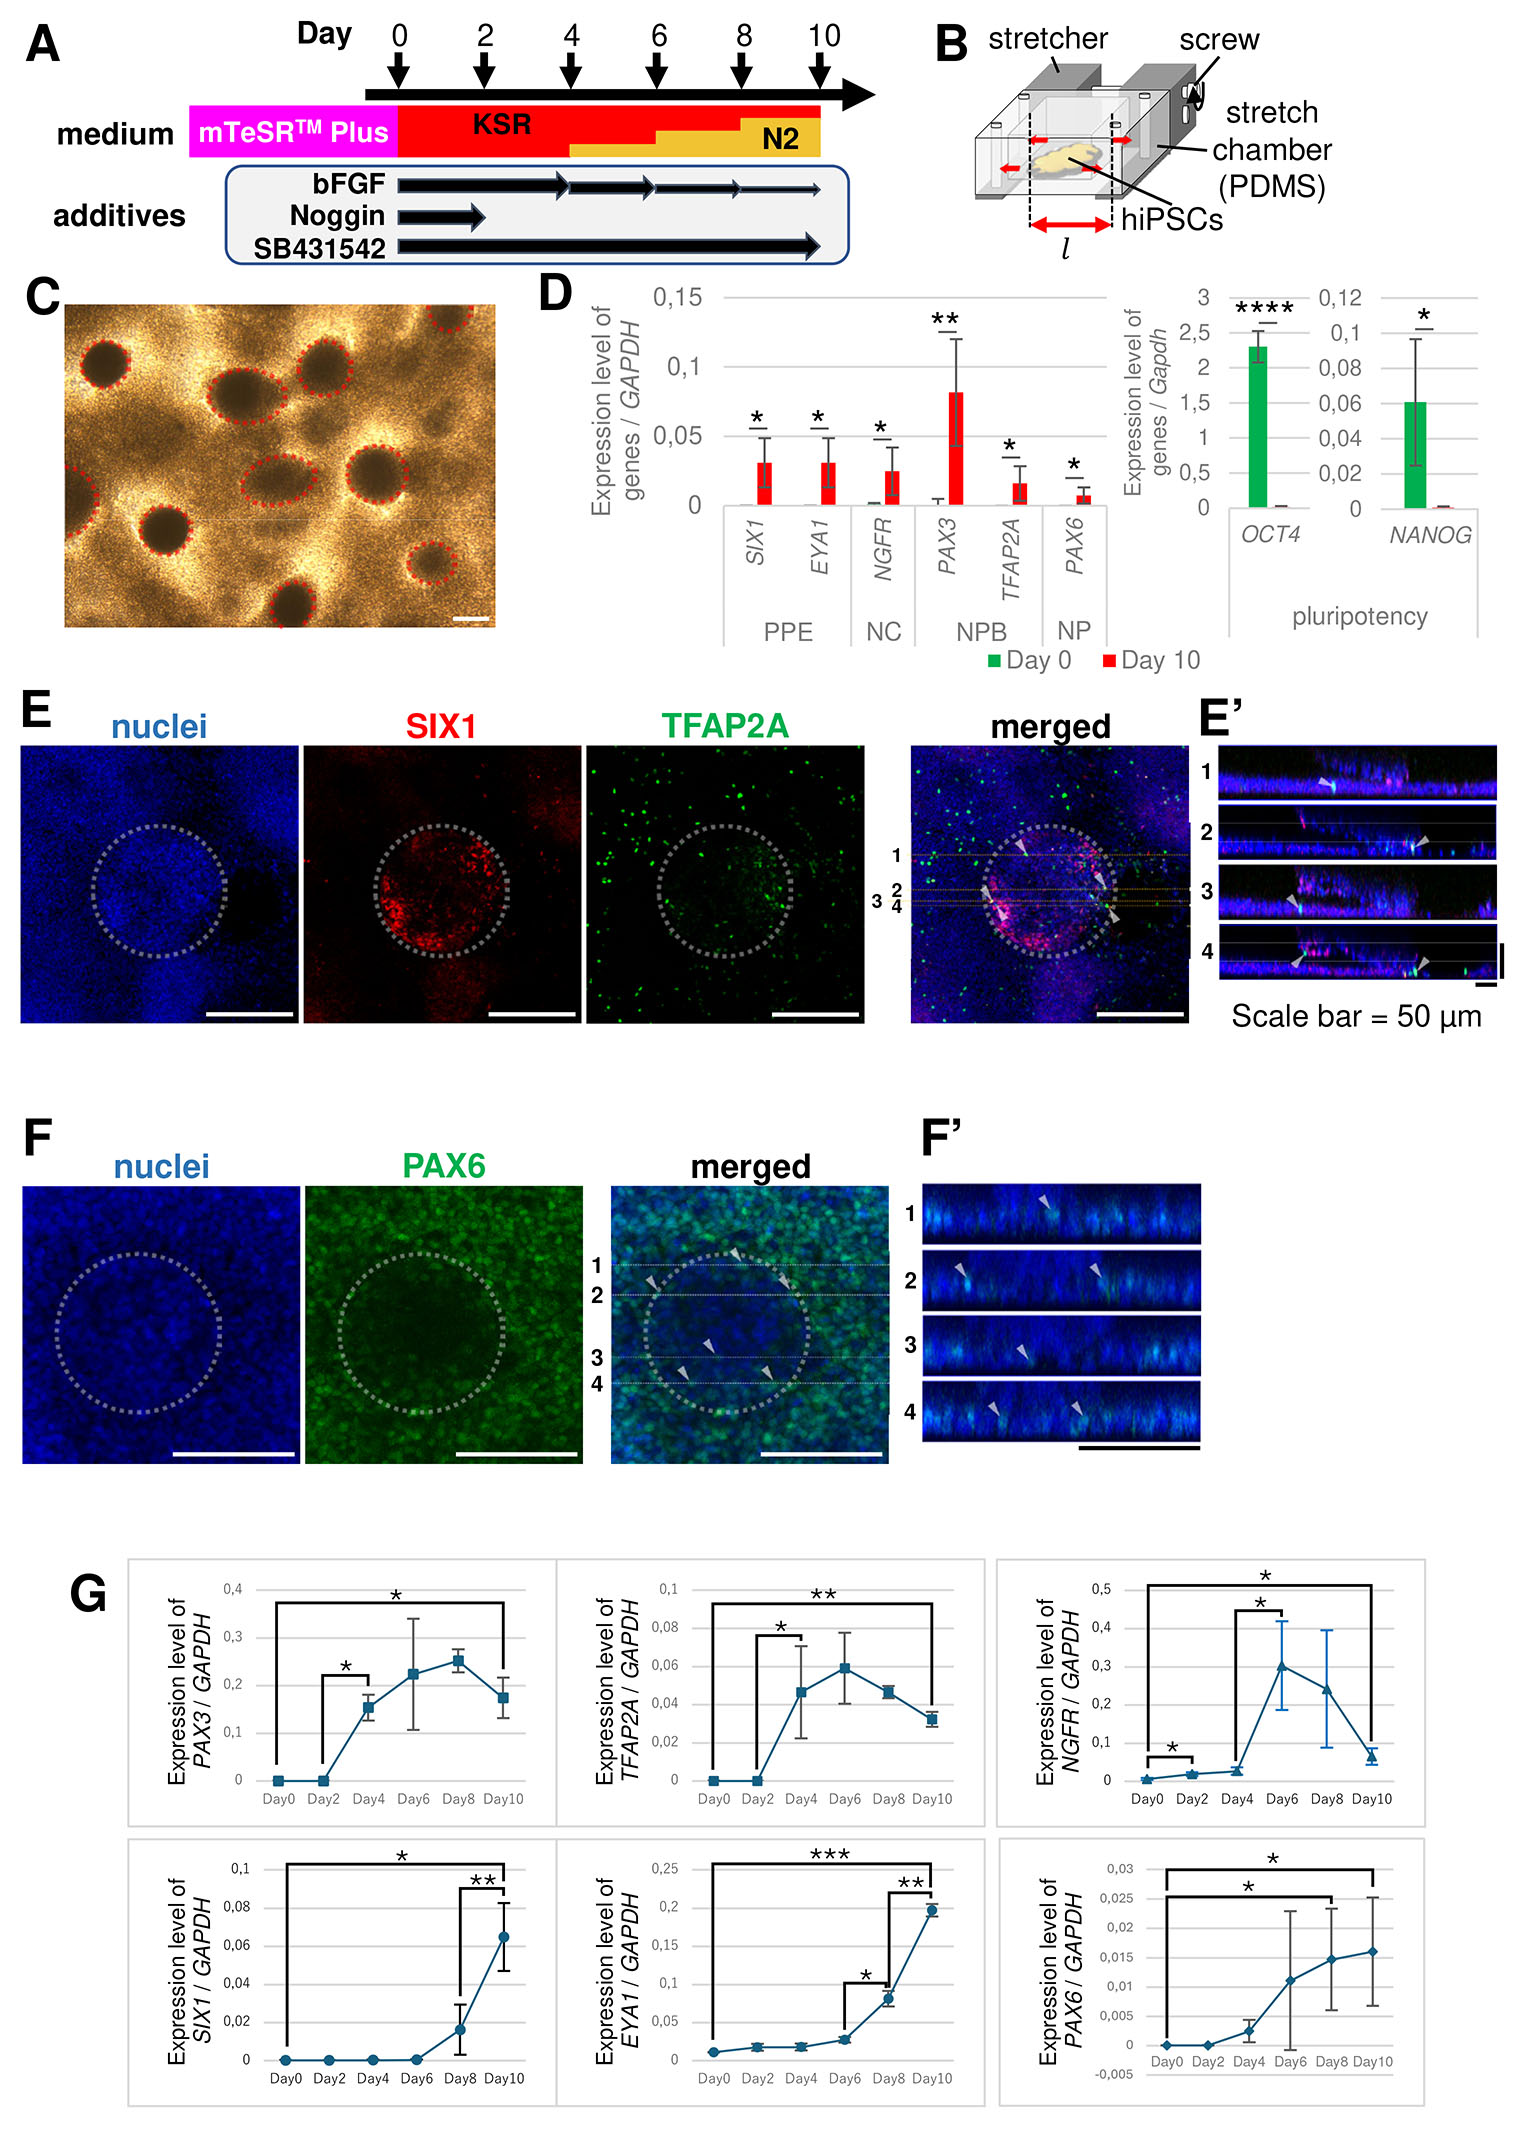
Fig. 1. Preplacodal ectoderm (PPE) induction protocol from human induced pluripotent stem cells (hiPSCs) on the stretch chamber.
(A) Schematic diagram of neuroectodermal cells, including the PPE induction protocol used in this study (see Materials and Methods for details). Day 0 indicates the onset of the induction. bFGF (10 ng/mL) was added to KnockOut™ Serum Replacement (KSR) medium, so that the final concentrations at Days 4–5, 6–7, and 8–9 were 7.5, 5.0, and 2.5 ng/mL, respectively. bFGF, basic fibroblast growth factor; Noggin, BMP antagonist; SB431542, TGF-β/SMAD inhibitor. (B) Schematic figure of stretch chamber and cell stretching system. The chamber well is 2×2 cm2 in area and 1 cm in height with a 500 µm thick layer, which can be stretched by rotating the screw. (C) Bright field image of the differentiated cells at Day 10. Hemispherical colonies were indicated by red dotted lines. Scale bar, 200 µm. (D) qRT-PCR analysis of each marker gene expression normalized to GAPDH at Day 10 and undifferentiated cells at Day 0 (Undif.). Undif, undifferentiated cells, green; Day 10, differentiated cells at Day 10, red. The error bars represent the standard deviations. n = 5 in each of markers except EYA1 (n = 4); *: p < 0.05; **: p < 0.01; ****: p < 0.0001; paired t-test. (E,F) Immunofluorescent staining using each marker. White dotted circles indicate the hemispherical colonies. (E’, F’) The cross-sectional diagrams of (E) and (F) along the Z-axis. The cell sheet was shown by a horizontal row of nuclei at the bottom, whereas the hemispherical colony was observed above the cell sheet. (E) SIX1+ (red) cells were highly expressed in the hemispherical colonies, and TFAP2A+ (green) cells were mainly in the cell sheets. (E’) The cross-sectional diagram of each line in (E). The white arrowheads indicate TFAP2A+ cells in cell sheet. (F) PAX6+ (green) cells were detected on the cell sheet. Although some positive signals seemed to be in the hemispherical colony, they were actually in the cell sheet (See F’). (F’) The cross-sectional diagram of each line in (F). White arrowhead indicates PAX6+ cell. Scale bar, 200 µm (E), 50 µm (E’), 100 µm (F, F’). (G) Time-course analysis of marker gene expression for NPB, NC, PPE, and NP by qRT-PCR. The expression level was normalized to GAPDH levels. The levels of PAX3, TFAP2A for the neural plate border had risen significantly after Day 2 and peaked around Day 6. Nerve growth factor receptor (NGFR) marker of the neural crest (NC) rapidly rose after Day 4, peaked around Day 6 then decreased. SIX1 and EYA1 for PPE increased after Day 6. n = 3; *, p < 0.05; **, p < 0.01; ***, p < 0.001; paired t-test.
As a result of the induction with this protocol, we observed that the colonies appeared as hemispheres on Day 10 (Fig. 1C). Hemispherical colonies were seen as dark domes with clear boundaries, and other regions were observed as cell sheets. The diameter of the hemispherical colonies were 100–300 µm. Quantitative RT-PCR (qRT-PCR) revealed that SIX1 and EYA1 PPE markers were significantly increased, and OCT4 and NANOG pluripotency markers were decreased on Day 10, compared to those in undifferentiated cells (Fig. 1D). Other markers related to neuroectodermal differentiation, nerve growth factor receptor (NGFR) for NC; PAX3 and TFAP2A for NPB; and PAX6 for NP, also significantly increased on Day 10. To analyze the spatial pattern of marker gene expression in hemispherical colonies and cell sheets, immunofluorescence staining was performed. We characterized hemispherical colonies by two conditions, globe-like shape and cell layer thicker than 25 µm in the cross-sectional view in Z-stack images (Fig. E’, F’), and the others were defined as the cell sheet. The colony characterized by immunofluorescence staining was similar to the dark domes in the bright-field images. In the hemispherical colonies, SIX1 was abundantly detected (Fig. 1E, Supplementary Fig. 2A). Although TFAP2A also seemed to be expressed in hemispherical colonies, cross-sectional views showed that most of their signals were observed in the cell sheet region (Fig. 1E, E’), while signals in hemispherical colonies were low (Supplementary Fig. 2A). PAX6 was expressed in the cell sheets (Fig. 1F, F’, Supplementary Fig. 2B). These data suggest that cells in cell sheets tend to differentiate into NPB- and NP-like cells, whereas those in hemispherical colonies differentiate into PPE-like cells.
To examine PPE differentiation in detail, we performed a time-course analysis of the expression level of each marker at 2-day intervals using qRT-PCR. The NPB (PAX3 and TFAP2A) and NC (NGFR) markers significantly increased after Day 2 and 4, respectively. These expressions peaked at approximately Day 6 and decreased thereafter (Fig. 1G). The PAX6 NP marker gradually increased after Day 2. In contrast, SIX1 and EYA1 PPE markers were gradually increased after Day 6. These results suggest that, in our differentiation, NPB cells were induced after Day 2, followed by differentiation to PPE cells after Day 6. The order of expression was similar to that in vivo expression in vertebrates (Griffin and Saint-Jeannet, 2024; Schlosser, 2010; Streit, 2004). Overall, we established a protocol in which PPE cells were differentiated in stretch chambers.
SIX1 expression was increased by stretching stimuli from day 2 of during the differentiation
We performed stretching experiments during differentiation. We considered that the effect of a single and long-term stretching may be attenuated for several reasons, such as force-dependent change of direction in cell division. Therefore, we thought that repetitive stimulation is appropriate for effective application of the force. The stretching and relaxation periods were set to 2 h (Fig. 2A). There is no automatic stretching device that can extend the chamber up to a fold change of 1.5 (50% stretching), therefore, we built an automatic stretcher (Supplementary Fig. 3). With these devices, we applied stretching stimuli from Day 2, when NPB differentiation started (Fig. 1G). Each chamber was stretched at ratios of 10, 20, 30, and 50%, respectively. Because the stretch chambers were not maintained the shape of rectangle when stretched in a higher stretch rate, the actual extensions of cells in different points at one layer were investigated by analyzing immunofluorescent images of ZO-1, a protein of tight junctions (Supplementary Fig. 4 B-C). The farthest points from the centerline showed significantly lower value of average rSMA, a ratio of the semi major axises, compared to that in the centerline (Supplementary Fig. 4C). Therefore, when obtained the immunofluorescence images, the points were chosen around the centerline.

Fig. 2. Changes in gene expression due to stretching stimuli applied from Day 2.
(A) Schematic diagram of the stretching stimuli during differentiation. The protocol for the differentiation was the same as Fig. 1A. The pulsed cycle consisted of 2 h intervals of stretching and relaxation from Day 2. The conditions of stretch rate were 10, 20, 30, and 50%. (B) qRT-PCR analysis of each marker at Day 10 with the stimuli. Changes in expression levels are indicated as fold changes in the ratio of stretched sample to control (0%). The box indicates the interquartile range (IQR), spanning from the 25th percentile to the 75th percentile. The dashed lines in each graph indicate 1, meaning the expression level in the stretched sample was the same as in the control. Only significant differences between stretched and control samples are expressed. n(gene) = (10%, 20%, 30%, 50%): n(SIX1) = (6, 5, 6, 12); n(EYA1) = (4, 4, 4, 4); n(NGFR) = (6, 5, 6, 5); n(TFAP2A) = (6, 5, 6, 12); n(PAX3) = (6, 5, 6, 12); n(PAX6) = (6, 5, 6, 12). On the numbers of control, nCtrl(gene) = (10%, 20%, 30%, 50%): nCtrl(SIX1) = (6, 5, 6, 12); nCtrl(EYA1) = (4, 4, 4, 4); nCtrl(NGFR) = (6, 5, 6, 5); nCtrl(TFAP2A) = (6, 5, 6, 12); nCtrl(PAX3) = (6, 5, 6, 12); nCtrl(PAX6) = (6, 5, 6, 12); *: p < 0.05; one sample t-test. (C) Bright field image (top) and immunofluorescent staining of SIX1 (red) and TFAP2A (green) (bottom) at Day 10. Red arrowheads indicate the direction of stretching. Hemispherical colonies are indicated with red (top) and white (bottom) dotted circles respectively. Scale bar, 200 µm. (D) qRT-PCR analysis of PAX3, TFAP2A, NGFR, and PAX6 at Day 6. The box indicates the interquartile range, spanning from the 25th percentile to the 75th percentile. The dashed lines in each graph indicate 1, meaning the expression level in the stretched sample was the same as in the control. n = 3; ns, not significant; paired t-test.
As a result, SIX1 and TFAP2A expression significantly increased on Day 10 when a stretch rate of 50% was applied (Fig. 2B). The fold changes were 1.886 ± 1.059 (SIX1) and 1.520 ± 0.635 (TFAP2A). No significant changes were observed in the expression of other genes. In bright-field images, the number of hemispherical colonies in the cell sheet appeared to increase in the stretched samples (Fig. 2C, top). To examine the differences in the spatial expression of markers between hemispherical colonies and the cell sheet, we performed immunohistochemistry for SIX1 and TFAP2A (Fig. 2C, bottom). SIX1 protein was detected in hemispherical colonies as well as in cell sheets (Fig. 2C, Supplementary Fig. 5A). There were also a few cells expressing SIX1 in the cell sheets of the control samples, but to a lesser extent than in that of the stretched samples. TFAP2A expression was also increased by stretching stimuli and frequently co-expressed with SIX1 (Supplementary Fig. 5A). These results suggest that both PPE and NPB differentiation were enhanced by the 50% stretching stimuli.
In a stretch rate of 30%, only SIX1 expression significantly increased, and the fold change was 1.673 ± 0.561 (Fig. 2B). However, there were no significant changes in the NPB markers. To examine whether the NPB marker expression changed at the peak of expression (Fig. 1G), we performed qRT-PCR analysis on Day 6 (Fig. 2D). As a result, no significant differences were observed in the expression of PAX3, TFAP2A, NGFR, or PAX6. In addition, the expression of SIX1 and EYA1 was almost undetectable (Supplementary Fig. 5C), similar to the results of the time-course analysis (Fig. 1G). Although there were no significant changes in NPB genes on Day 6 and 10, by comparing the results for 0, 30, and 50% stimuli (Fig. 2B), the levels of PAX3 and TFAP2A tended to increase with the stretch rate.
The cell sheets were frequently torn or peeled off from the chamber when 50% stretching stimuli were applied, therefore, we adopted a rate of 30% stretching in subsequent experiments.
No significant increase in SIX1 expression by the stimuli was observed when the stretching was initiated from Day 5
Next, we investigated whether responsiveness to stretching stimuli changes during differentiation. Day 5 was around the peak of NPB marker expression (Fig. 1G) which is affected by tension (Xue et al., 2018), therefore, we observed the effect of stimuli application from Day 5 (Fig. 3A). Stretching from Day 2 was used as a positive control in each experiment. Although SIX1 expression level significantly increased when the stimuli were applied from Day 2 (Fig. 3B), this increase was not clearly observed from Day 5 (Fig. 3B). There were no significant changes in other genes (EYA1 for PPE, NGFR for NC, PAX3 and TFAP2A for NPB, and PAX6 for NP) in the stimuli from Day 5 as well as from Day 2. To determine whether there is a specific period to promotes SIX1 expression during Day 2 to 10, we conducted additional experiments with the condition in which the stretching stimuli was applied from Day 2 to 7, which is the same period as Day 5 to 10 (Fig. 3A). The results demonstrated a significant increase in SIX1 expression compared to the control as well as the condition from Day 2 to 10 (Fig. 3C). These results suggest that stretching stimuli in the early stage were sufficient to enhance PPE differentiation.
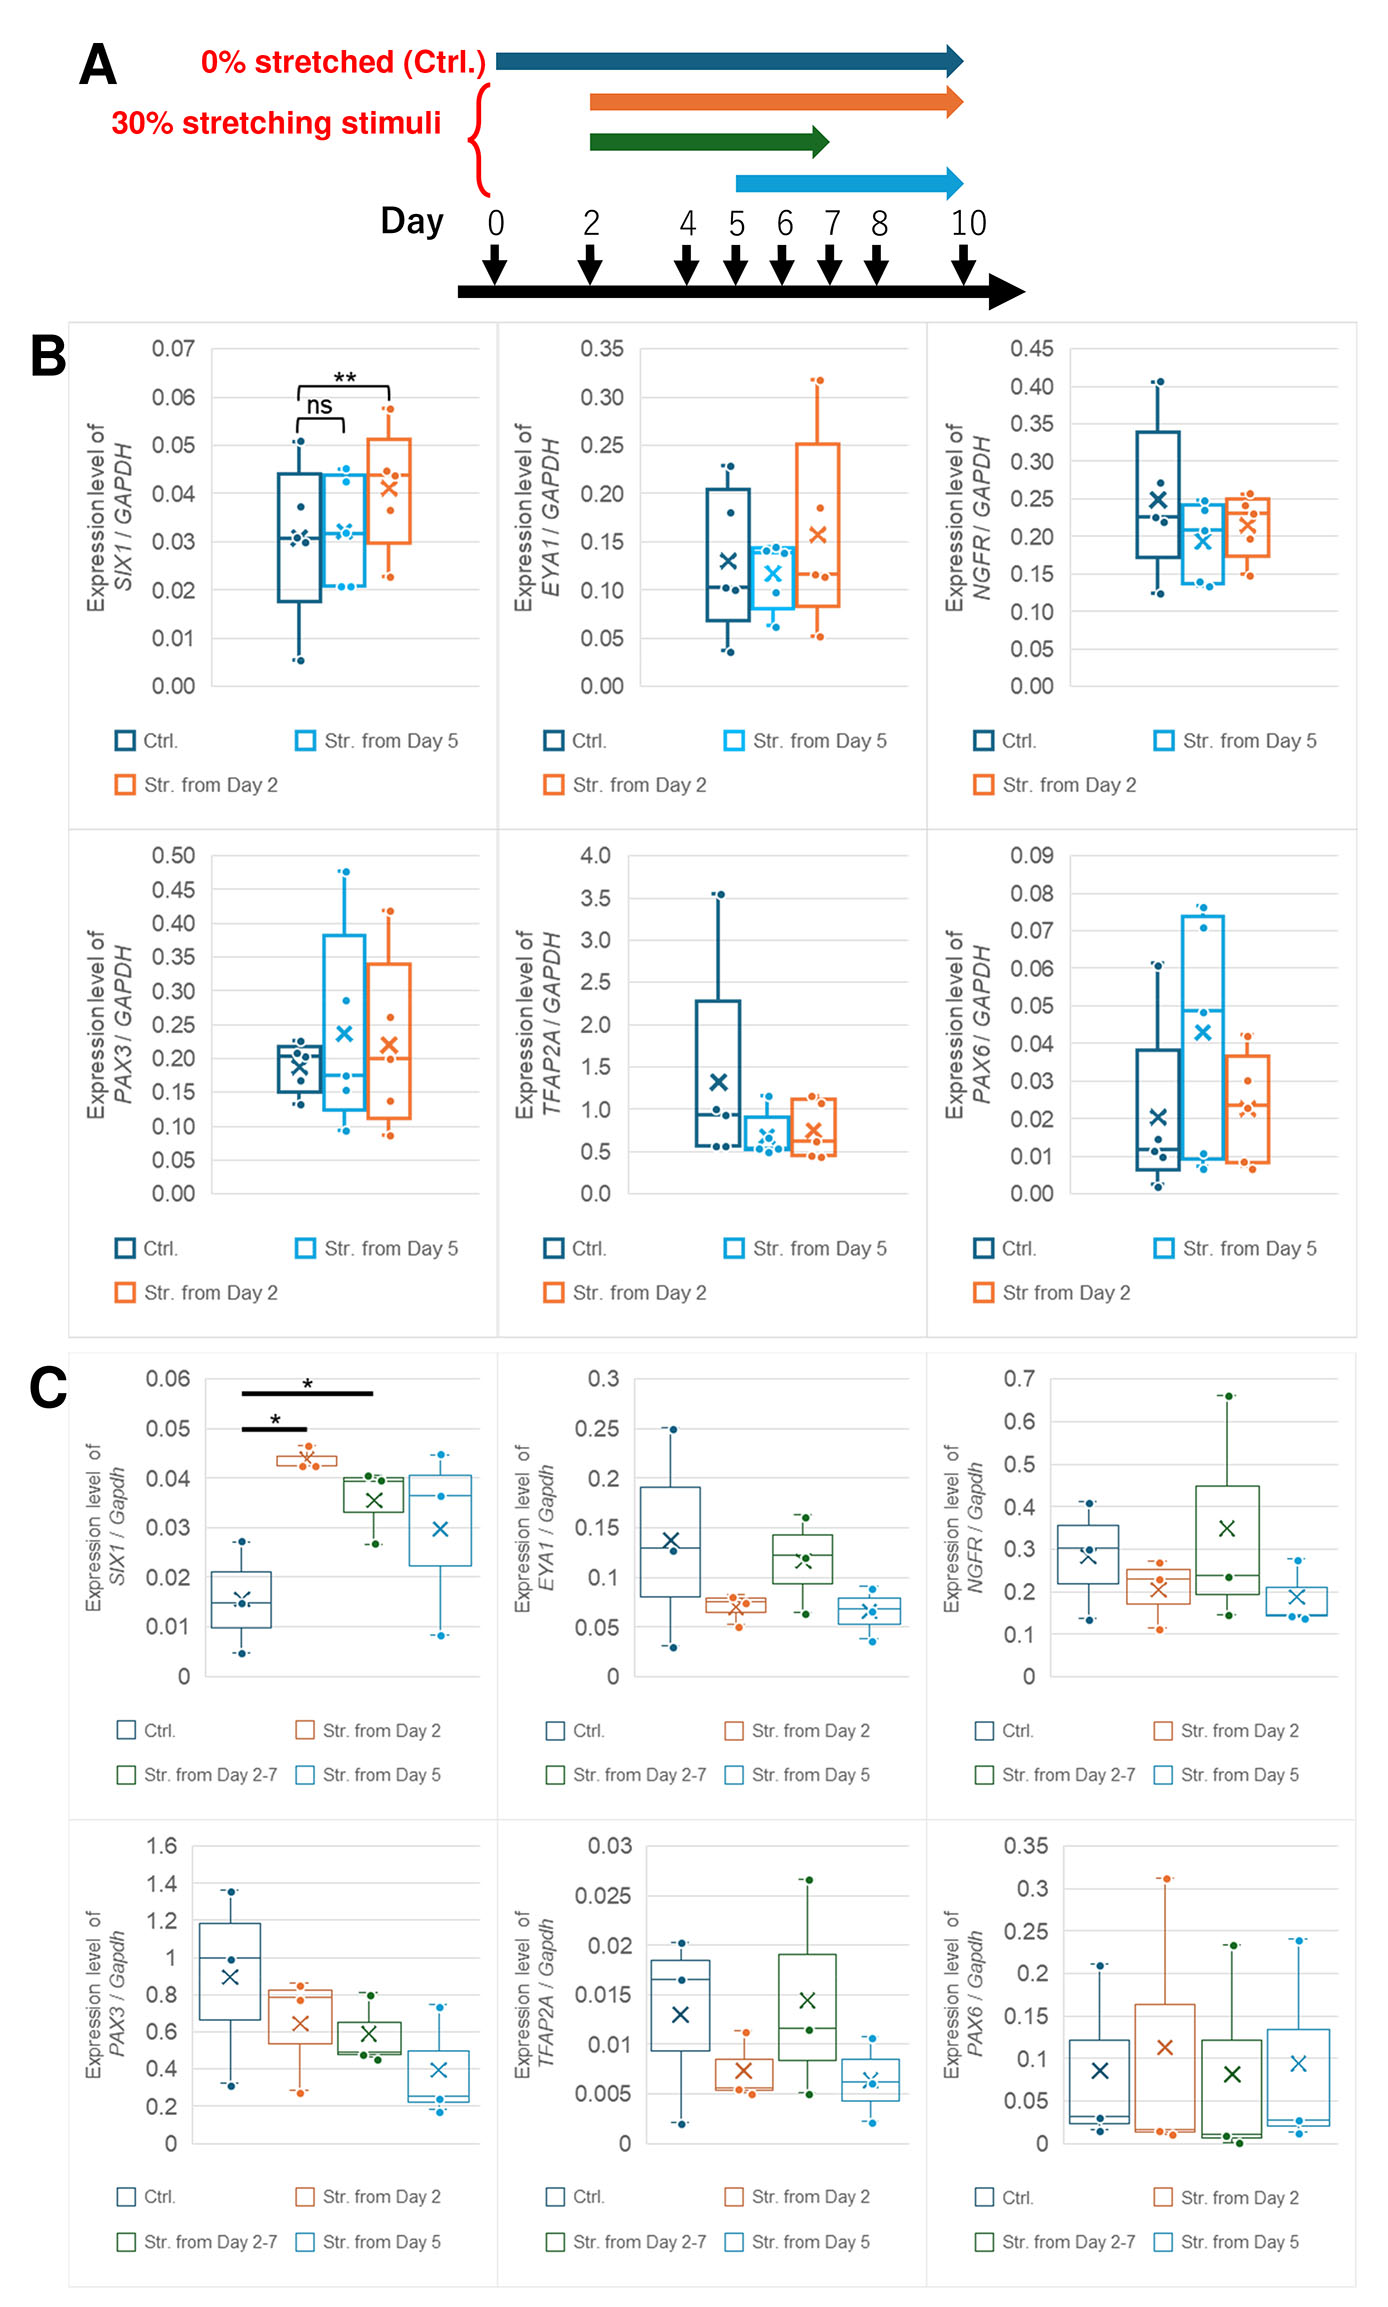
Fig. 3. Stretching stimuli from Day 5 was not sufficient to enhance the expression of any genes.
(A) Schematic diagram of stretching stimuli during PPE induction. The conditions of the differentiation media and additives were the same as Fig. 1A. Colored arrows indicate the duration of stretching stimuli. Two (B) or Three (C) stimuli conditions and control were performed at the same time in each experiment. (B) qRT-PCR analysis of each marker at Day 10. The box indicates the IQR, spanning from the 25th percentile to the 75th percentile. The line inside the box shows the average, whereas X shows the median. Only the level of SIX1 in stretched samples from Day 2 was significantly increased. There were no significant differences between stretched and control samples in the other markers in every stimuli condition. n = 5; **, p < 0.01; paired t-test. (C) qRT-PCR analysis of each marker at Day 10. The box indicates the interquartile range spanning from the 25th percentile to the 75th percentile. The line inside the box shows the average, whereas X shows the median. Only significant notations between stretched and control samples are expressed. The level of SIX1 in stretched samples from Day 2 and Day 2-7 was significantly increased. There were no significant differences between stretched and control samples in the other markers under every stimuli condition. n = 3; **, p < 0.01; paired t-test.
The enhancement of SIX1 expression by stretching stimuli was disrupted by inhibition of cytoskeletal signaling
Physical deformation of cells through mechanical forces directly affects the cytoskeleton, leading to the reorganization of actin stress fibers (Neidlinger-Wilke et al., 2001; Okura et al., 2023; Sato et al., 2005). This process is regulated by the RhoA/ROCK pathway, and Y-27632 is widely used for a ROCK inhibitor. To investigate whether the stretch-induced increase in SIX1 expression is associated with actin stress fiber reorganization, Y-27632 addition during the stretching stimuli was conducted (Fig. 4A). The results showed that the promotion of SIX1 expression by stretch stimuli was disrupted in the presence of Y-27632, and the difference in SIX1 expression between stretched and non-stretched conditions was no longer observed (Fig. 4B). Further analysis of other marker genes, NGFR for NC, PAX3 and TFAP3A for NPB, PAX6 for NP, revealed no significant changes under any condition, regardless of the presence or absence of stretch stimulation or Y-27632 treatment.
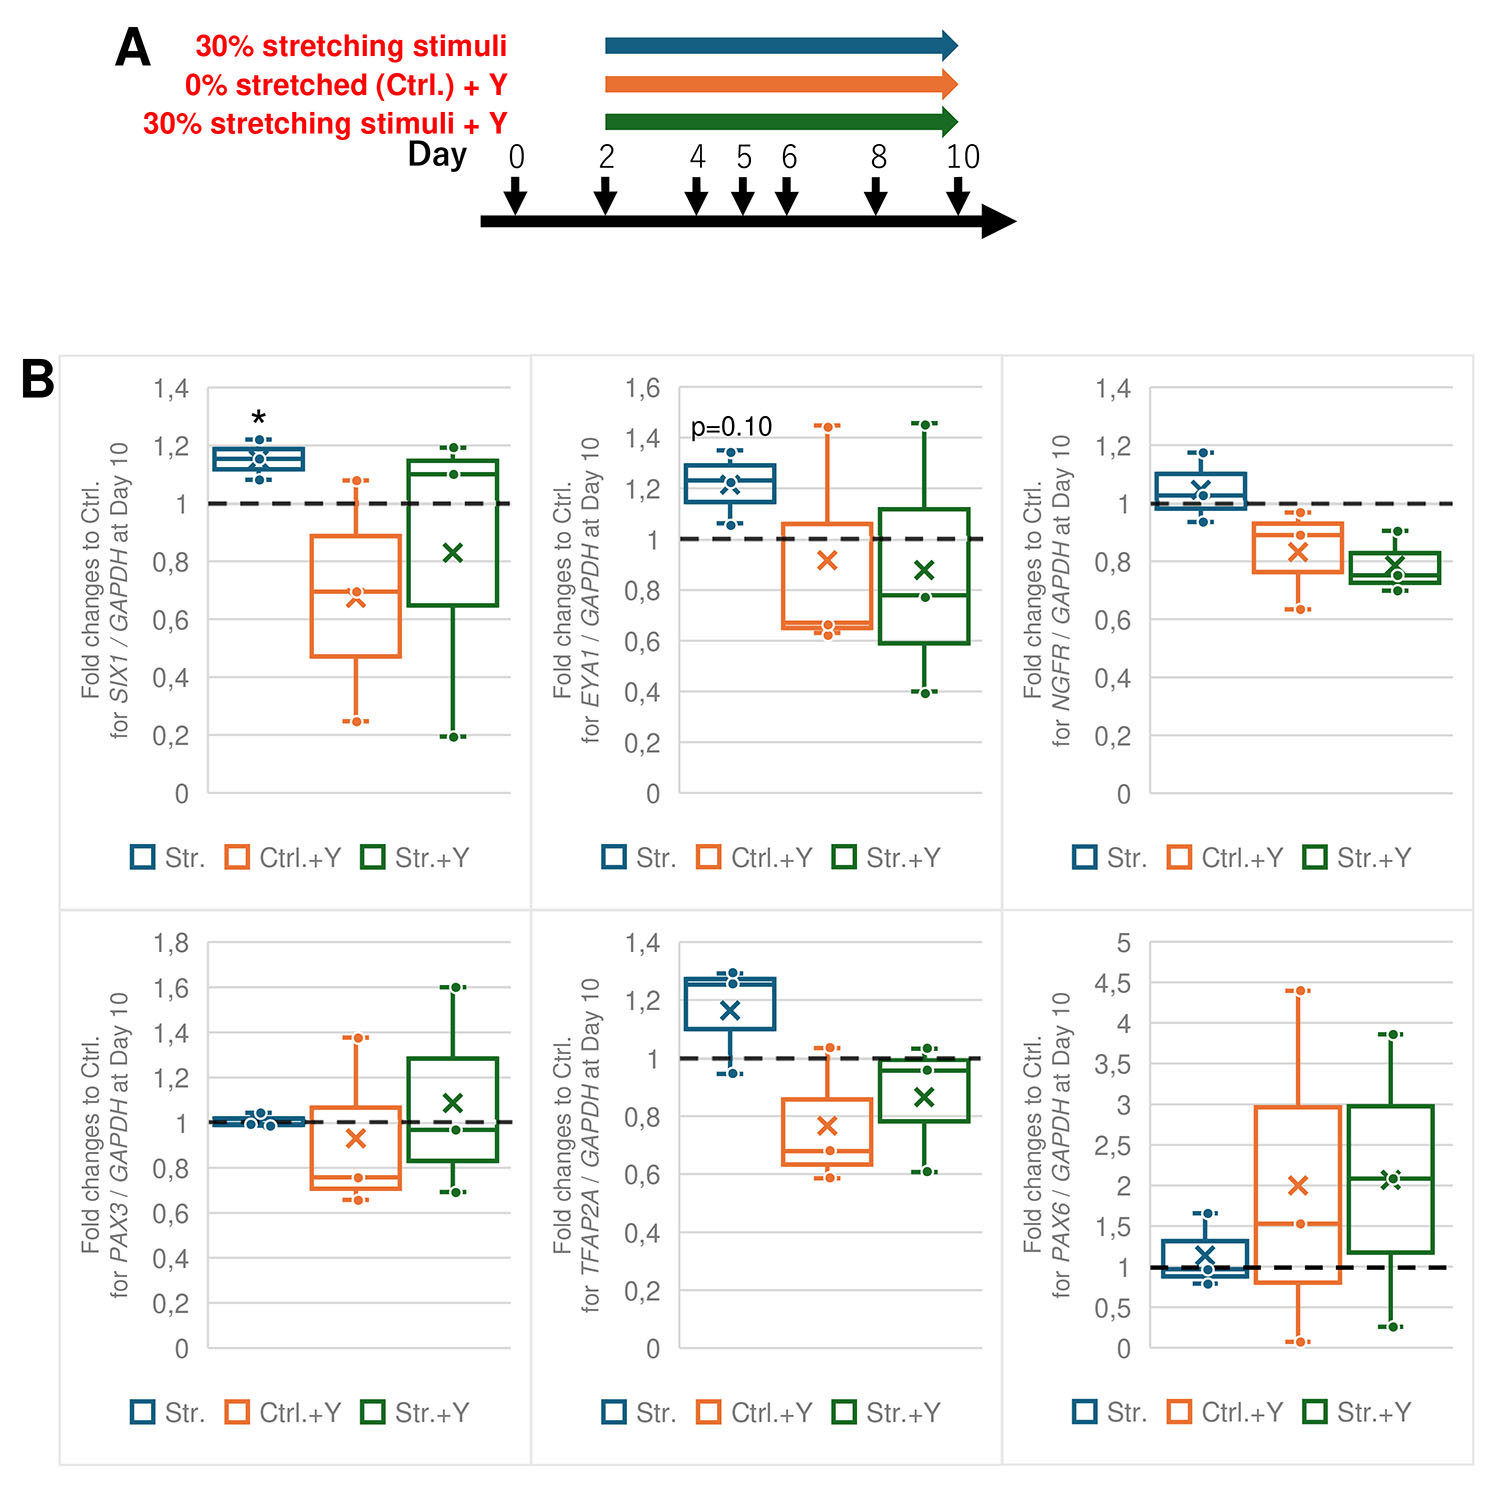
Fig. 4. Inhibition of ROCK under 30% stretching from Day 2.
(A) Schematic diagram of inhibition of ROCK and stretching stimuli during PPE induction. The conditions of the differentiation media and additives were the same as Fig. 1A. Colored arrows indicate the duration of stretching stimuli and treatment of Y-27632 (Y), ROCK inhibitor. Three conditions and control (no treatment of Y and 0% stretching) were performed at the same time in each experiment. (B) qRT-PCR analysis of each marker at Day 10. The box indicates the the interquartile range spanning from the 25th percentile to the 75th percentile. The line inside the box shows the average, whereas X shows the median. Only significant notations between stretched and control samples are expressed. The level of SIX1 in stretched samples was significantly increased. There were no significant differences between stretched and control samples in the other markers under every stimuli condition. n = 3; *, p < 0.05; paired t-test.
These results suggest that the enhancement of SIX1 expression by stretch stimuli is mediated through the RhoA/ROCK pathway and the reorganization of actin stress fibers.
SIX1 expression promoted by stretching stimuli is correlated to downregulation of β-catenin signaling
The Wnt signaling pathway is crucial for PPE differentiation (Griffin and Saint-Jeannet, 2024; Groves and LaBonne, 2014). In addition, β-catenin, a downstream of Wnt pathway, functions as a mechanotransducer (Muncie et al., 2020; Przybyla et al., 2016). To examine whether the level of Wnt signaling was changed by the stretching stimuli, we performed immunofluorescence staining against active β-catenin (ABC), which recognizes an active form of β-catenin.
Consistent with the qPCR analysis on the 30% stretching (Fig. 2B), the stronger signals of SIX1 were observed in stretched sample than control. On the other hand, the ABC signal appeared lower in the stretched samples than that in the controls, both in cell sheets and hemispherical colonies (Fig. 5A). We carried out quantitative analysis to confirm this observation. Only the signal in the cell sheets not including hemispherical colonies was quantified, because the ABC intensity in hemispherical colonies varied depending on the size of the colonies. The intensities were measured as mean gray values (Fig. 5B). Consistent with the above observations, the average ABC signals of the stretched samples were significantly weaker than those of the control samples, suggesting that Wnt signaling was downregulated (Fig. 5B). These results suggest a negative correlation between stretching stimuli and Wnt signaling, which should be downregulated for PPE differentiation.
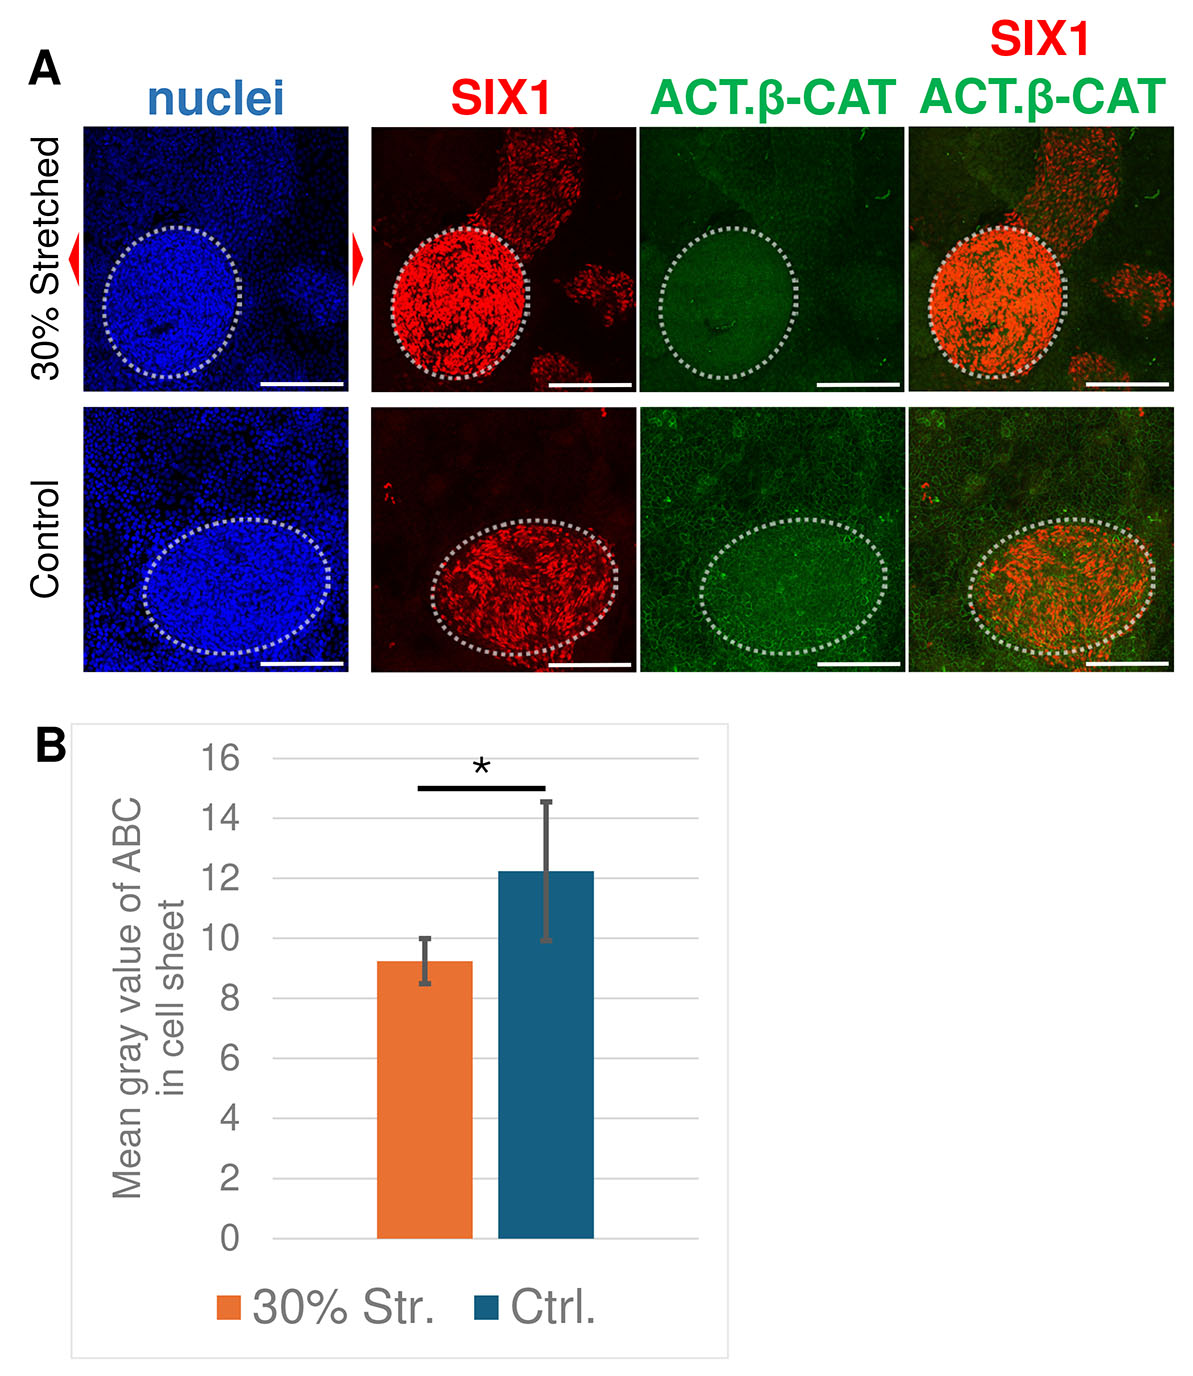
Fig. 5. Stretched samples showed lower levels of active β-catenin (ABC) in the cell sheet.
(A) Immunofluorescent staining against SIX1 (red) and active β-catenin (green). Stretching stimuli were applied from Day 2. Red arrowheads indicate the direction of stretching. Hemispherical colonies are indicated with white dotted circle. Scale bar, 200 µm. (B) Quantification of the average ABC intensity between 30% stretched and control samples. The intensities in control samples were significantly higher than those in stretched samples. n = 3; *, p < 0.05; two-sample t-test.
Discussion
In this study, we established a modified differentiation method to optimize PPE differentiation. Time-course analysis of marker gene expression indicated that PPE genes (SIX1 and EYA1) and PAX6 expression was gradually increased throughout differentiation, whereas the expression of NC (NGFR) and NPB (PAX3 and TFAP2A) genes peaked on Day 6 (Fig. 1G). One of the reasons for this is that the NC cell was not rigidly fixed or flexibly changeable on Day 6. Indeed, border located undecided progenitors (BLUPs) are found in chick embryos (Thiery et al., 2023). Therefore, even if the cells expressed NGFR on Day 6, they might just be BLUPs, and their fate could shift to PPE or other cell types.
We demonstrated that SIX1 and TFAP2A expression were enhanced by stretching stimuli during differentiation. By 50% stretching, the expression of SIX1 and TFAP2A were increased, whereas 30% stretch caused only an increase in SIX1 expression, suggesting that the sensitivity of gene expression to stretching stimuli differs between SIX1 and TFAP2A. One possibility is that stretching stimuli lead presumptive NC cells to differentiate into PPE cells, but this may be unlikely because NGFR expression, which reflects NC differentiation, did not decrease (Fig. 2). Currently, we consider that stretching stimuli mainly increase SIX1 expression and that NPB differentiation is secondarily promoted by these stimuli. Thus, it is expected that PPE differentiation is promoted, although the expression of EYA1 is not enhanced by stretching stimuli despite being a PPE marker (Moody and LaMantia, 2015; Singh and Groves, 2016). It is known that their transcriptional regulators are not the same: Dlx/Msx/GATA for Six1 and Dlx/Msx/FoxI1 for Eya1 (Ishihara et al., 2008; Sato et al., 2010; Schlosser, 2014). As some elements of GATA are activated by mechanical cues (Frye et al., 2018; Ghantous et al., 2015), the enhancement of SIX1, but not EYA1, by stretching stimuli may be caused by its regulation via GATA. Therefore, the stretching stimuli may affect only a limited set of genes, rather than the entire gene network related to PPE differentiation.
Considering the stretching stimuli from Day 2 to 7 and from Day 2 to the end, suggesting that the stimuli for 5 days was sufficient to enhance PPE differentiation (Fig. 3C). However, the stimuli from Day 5 to the end for 5 days, did not enhance SIX1 expression, suggesting a critical period for the enhancement may exist from Day 2 to 5.
In our study, β-catenin activity had a negative correlation with stretching stimuli. These results were unexpected because previous studies have reported that Wnt signaling is activated by mechanical forces in the bone, mesenchymal stem cells, vasculature, and epithelial cells (Arnsdorf et al., 2009; Li et al., 2014; Rubin et al., 2006; Samuel et al., 2011). Nevertheless, our results may imply the existence of the upstream and unknown pathway activated by the mechanical force, substantially downregulating even mechanically activated Wnt signaling, which resulted in lower β-catenin signals.
Our results provide motivation to clarify the mechanobiological mechanisms of PPE differentiation and improvement method of PPE differentiation efficiency in applications for the medical field. Although there are protocols for PPE induction (Bricker et al., 2022; Ealy et al., 2016; Matsuoka et al., 2017), their differentiation efficiencies remain limited (Dincer et al., 2013; Ealy et al., 2016; Leung et al., 2013; Matsuoka et al., 2017; Tchieu et al., 2017). Combining with stretching stimuli in these protocols may help to increase differentiation efficiency, as well as to reduce the additives to minimize unexpected side effects of transplantation.
Materials and Methods
Cell culture
The 201B7 hiPSC line established from dermal fibroblasts was used. The hiPSCs were cultured and maintained on a 12-well plate coated with Matrigel® (Corning) using mTeSRTM Plus (Stemcell Technologies) medium without mouse embryonic fibroblast feeder cells, at 37 °C in 5% CO2. Cells were passaged at a dilution of 1:60 to 1:100 until they reached approximately 80% confluency. The cells were dissociated using 0.02% ethylenediaminetetraacetate (EDTA) in PBS. Just after the passage, cells were cultured with 10 µM Rho-associated kinase (ROCK) inhibitor Y-27632 (AdooQ Bioscience) in mTeSRTM Plus medium, and Y-27632 was withdrawn after 24–48 h. The medium was changed once every two days.
Media for differentiation
KSR medium consisted of DMEM/F12 (Gibco) supplemented with 20% KnockOutTM Serum Replacement (Gibco), 0.1 mM 2-mercaptoethanol (Sigma-Aldrich), 0.8×Non-essential Amino Acids for Minimum Essential Medium Eagle (MP Biomedicals), 0.8% penicillin-streptomycin (Sigma-Aldrich), and 10 ng/mL bFGF (Wako). The N2 medium consisted of DMEM/F12 supplemented with 1% N2 Supplement (Gibco), 1 mM L-glutamine (Sigma-Aldrich), and 0.5% penicillin-streptomycin (Nihei et al., 2013). The differences of media composition between in this study and in Dincer et al., 2013 is summarized in Table 1.
Table 1
The difference of KSR and N2 media used between our study and Dincer et al., (2013)
| Final concentration in DMEM/F12 | Our study | Dincer et al., 2013 |
|---|---|---|
| KSR medium | ||
| Knockout serum replacement | 20%v/v | 15%v/v |
| 2-mercaptoethanol | 0.11 mM | 0.055 mM |
| 100× Non-essential Amino Acids | 0.8× | 1× |
| L-Glutamine | - | 2 mM |
| Penicillin-Streptomycin | 80 U/mL Penicillin 80 µg/mL Streptomycin |
100 U/mL Penicillin 100 µg/mL Streptomycin |
| final concentration in DMEM/F-12 | in our study |
in Dincer et al., 2013 |
| N2 medium | ||
| 100× N2 supplement |
1× | 1× |
| L-Glutamine | 1 mM | - |
| Penicillin-Streptomycin | 50 U/mL Penicillin 50 µg/mL Streptomycin |
- |
| 2-mercaptoethanol | - | 0.055 mM |
| sodium bicarbonate | - | 2.0 g/L |
| D-(+)-Glucose | - | 1.56 g/L |
| progesterone | - | 6.4 µg/L |
Hydrophilic treatment of stretch chamber
All the stretch chambers were sterilized by autoclave before use. To improve cell attachment, stretch chambers (SC-0040, Strex) were hydrophilized with UV-C (254 nm, TUV 15W/G15T8, Philips) for 30 min immediately before being coated with Matrigel.
PPE induction
When hiPSCs reached approximately 80% confluency, cells were dissociated using Accutase® (Gibco) and plated at a density of 1.2 × 10⁵ cell/cm2 on hydrophilic-treated and Matrigel-coated stretch chambers in mTeSRTM Plus medium including 10 µM Y-27632. After 24 h, Y-27632 was removed, and the medium was changed at least twice.
When 95% confluency is reached, set as Day 0, PPE differentiation was initiated using KSR medium with 10 µM SB431542 (Wako) and 100 ng/mL Noggin (PeproTech). Noggin was withdrawn on Day 2. From Day 4, the ratio of KSR:N2 media was changed 3:1, 1:1, 1:3 every two days while maintaining 10 µM SB431542 as shown in Fig. 1A. The medium was changed daily during the differentiation.
For the inhibition of cytoskeletal signaling, 10 µM Y-27632 was added to the media.
Construction of automatic stretcher
An automatic stretcher was constructed using commercial metal components (Supplementary Fig. 3). The screw of Manual Cell Stretching System (ST-0040, Strex) was connected to a stepping motor (28BYJ-48) with a universal joint (UJ6-5, Asa Electronics Industry). The motor was connected to a driver board (ULN2003A) and controlled using an Arduino Mega 2560. We added a real time clock module (DS3231, ±2 ppm), display panel (TM1637), and keypad module (8 Push Buttons) for the timer to the system. The code (sketch) was built using the Arduino IDE (see Supplementary Information).
Immunohistochemistry
Cells were fixed and immunostained with a standard protocol (Ninomiya et al., 2015). Briefly, 4% paraformaldehyde/PBS was used to fix cells, then permeabilized with 0.3% Triton X-100/PBS (Wako), followed by blocking with 10 mg/mL bovine serum albumin (BSA, Wako) in PBS-T. Primary antibodies used are listed in Table 2.
Table 2
List of primary antibodies used in immunofluorescence staining
| Protein | Vendor | Catalog number | Dilution |
|---|---|---|---|
| SIX1 | Sigma-Aldrich | HPA001893 | 1:250 |
| SOX9 | DSHB | DA1D1 | 1:10 |
| PAX3 | Affinity Biosciences | DF6548 | 1:300 |
| TFAP2A | DSHB | 3B5 | 1:16 |
| PAX6 | DSHB | PAX6 | 1:16 |
Active β-catenin |
Millipore | 05-665 | 1:300 |
| ZO-1 | DSHB | R26.4C | 1:50 |
Goat anti-mouse Alexa Fluor 488 (1:600; Invitrogen), goat anti-mouse IgG-FITC (1:400; Sigma-Aldrich), and donkey anti-rabbit Alexa Fluor 594 (1:600; Invitrogen) were used as secondary antibodies. Nuclei were stained with TO-PRO®-3 (Invitrogen, 1:400). The specimens were mounted using Prolong Gold Antifade Reagent (Invitrogen) or Immunoselect Antifading Mounting Medium (Dianova GmbH). Fiji was used to quantify the signal intensity in gray values or colors.
Analysis of the actual cell extension
hiPSCs were cultured on stretch chambers until they formed single layer with 80% confluency, then immunostained with ZO-1 by the same protocol above. Cell membranes were traced from the immunofluorescence images and approximated the cells by ellipse fitting method. The actual extension was analyzed by calculating the ratio of the semi major axis (rSMA) obtained by rSMA = aS/aC, rSMA = aS/aC, where aS, aC are the semi major axes of a ellipse in stretched and control state, respectively (Supplementary Fig. 4B).
Quantitative RT-PCR (qRT-PCR)
Total RNAs were prepared using RNeasy kit (Qiagen) and reverse transcribed using SuperScriptTM III Reverse Transcriptase kit (Invitrogen). qRT-PCR was carried out using KAPA SYBR® Fast qPCR kit (KAPA Biosystems) and StepOnePlusTM system (Applied Biosystem). All results were normalized to those obtained using GAPDH as a housekeeping gene. All experiments were performed with at least three biological replicates. The primer sets used for the qRT-PCR are listed in Table 3.
Table 3
List of primers used in qRT-PCR
| Genes | Forward (5ʹ to 3ʹ) | Reverse (5ʹ to 3ʹ) |
|---|---|---|
| GAPDH | GACATCAAGAAGGTGGTGAA | TGTCATACCAGGAAATGAGC |
| OCT4 | CGAAAGAGAAAGCGAACCAGT | AACCACACTCGGACCACATCC |
| NANOG | CGCAAAAAAGGAAGACAAGGTCCC | GCATCCCTGGTGGTAGGAAGAGTA |
| SIX1 | AACCGGAGGCAAAGAGACCG | AGCTGGACATGAGCGGCTTG |
| EYA1 | GGACTATCCGTCTTATCCCAGT | GCTGCTGGTCATATAATGTGCTG |
| NGFR | TGGCCTACATAGCCTTCAAGA | GAGATGCCACTGTCGCTGT |
| PAX3 | TACAGGTCTGGTTTAGCAAC | GATCTGACACAGCTTGTGGA |
| TFAP2A | AGGTCAATCTCCCTACACGAG | GGAGTAAGGATCTTGCGACTGG |
| PAX6 | GCGGAAGCTGCAAAGAAATA | TTTGGCTGCTAGTCTTTCTCG |
Statistics
Statistical analysis was performed using one-sample t-test for fold change and paired t-test for comparing two groups with or without stretching, and two-sample t-test for extracted samples. All p values < 0.05 were considered statistically significant.
Supplementary Material
Acknowledgements
This study was conducted with the approval of the University of Tokyo (#18-293, #18-294).
We thank Dr. Keiko Mizuno (University of Tokyo, Japan) for help in starting this work; Mr. Hyeongtae Kim for the construction of the Arduino program; Ms. Junyi Chen for critical comments and editing of the manuscript and Editage (www.editage.com) for English language editing.
This work was supported in part by the Japan Society for the Promotion of Science (JSPS) KAKENHI (19K16138/23K05791 to TY, 18K06244/21K06183 to TY and TM, 24K02030 to TM), Yamada Science Foundation (to TY), Narishige Zoological Science Award (to TY).
The human iPS cell line was kindly provided by RIKEN BRC cell bank and Institute of Medical Sciences, the University of Tokyo.
References
Alasaadi D. N., Alvizi L., Hartmann J., Stillman N., Moghe P., Hiiragi T., Mayor R. (2024). Competence for neural crest induction is controlled by hydrostatic pressure through Yap. Nature Cell Biology 26: 530-541.
Alvarez Y., Smutny M. (2022). Emerging Role of Mechanical Forces in Cell Fate Acquisition. Frontiers in Cell and Developmental Biology 10: 864522.
Arnsdorf E. J., Tummala P., Jacobs C. R. (2009). Non-Canonical Wnt Signaling and N-Cadherin Related β-Catenin Signaling Play a Role in Mechanically Induced Osteogenic Cell Fate. PLoS ONE 4: e5388.
Ávila-González D., Gidi-Grenat M. , García-López G., Martínez-Juárez A., Molina-Hernández A., Portillo W., Díaz-Martínez N. E., Díaz N. F. (2023). Pluripotent Stem Cells as a Model for Human Embryogenesis. Cells 12: 1192.
Bricker R. L., Bhaskar U., Titone R., Carless M. A., Barberi T. (2022). A Molecular Analysis of Neural Olfactory Placode Differentiation in Human Pluripotent Stem Cells. Stem Cells and Development 31: 507-520.
Davidson L. A. (2017). Mechanical design in embryos: mechanical signalling, robustness and developmental defects. Philosophical Transactions of the Royal Society B: Biological Sciences 372: 20150516.
Dincer Z., Piao J., Niu L., Ganat Y., Kriks S., Zimmer B., Shi S.H., Tabar V., Studer L. (2013). Specification of Functional Cranial Placode Derivatives from Human Pluripotent Stem Cells. Cell Reports 5: 1387-1402.
Ealy M., Ellwanger D. C., Kosaric N., Stapper A. P., Heller S. (2016). Single-cell analysis delineates a trajectory toward the human early otic lineage. Proceedings of the National Academy of Sciences 113: 8508-8513.
Efimenko K., Wallace W. E., Genzer J. (2002). Surface Modification of Sylgard-184 Poly(dimethyl siloxane) Networks by Ultraviolet and Ultraviolet/Ozone Treatment. Journal of Colloid and Interface Science 254: 306-315.
Esmaeli M., Barazesh M., Karimi Z., Roshankhah S., Ghanbari A. (2024). Molecular signaling directing neural plate border formation. The International Journal of Developmental Biology 68: 65-78.
Frye M., Taddei A., Dierkes C., Martinez-Corral I., Fielden M., Ortsäter H., Kazenwadel J., Calado D. P., Ostergaard P., Salminen M., He L., Harvey N. L., Kiefer F., Mäkinen T. (2018). Matrix stiffness controls lymphatic vessel formation through regulation of a GATA2-dependent transcriptional program. Nature Communications 9: 1511.
Ghantous C. M., Kobeissy F. H., Soudani N., Rahman F. A., Al-Hariri M., Itani H. A., Sabra R., Zeidan A. (2015). Mechanical stretch-induced vascular hypertrophy occurs through modulation of leptin synthesis-mediated ROS formation and GATA-4 nuclear translocation. Frontiers in Pharmacology 6: 240.
Gokaltun A., Yarmush M. L., Asatekin A., Usta O. B. (2017). Recent advances in nonbiofouling PDMS surface modification strategies applicable to microfluidic technology. TECHNOLOGY 05: 1-12.
Griffin C., Saint-Jeannet J.P. (2024). In vitro modeling of cranial placode differentiation: Recent advances, challenges, and perspectives. Developmental Biology 506: 20-30.
Groves A. K., LaBonne C. (2014). Setting appropriate boundaries: Fate, patterning and competence at the neural plate border. Developmental Biology 389: 2-12.
Ishihara T., Sato S., Ikeda K., Yajima H., Kawakami K. (2008). Multiple evolutionarily conserved enhancers control expression of Eya1 . Developmental Dynamics 237: 3142-3156.
Jackson T. R., Kim H. Y., Balakrishnan U. L., Stuckenholz C., Davidson L. A. (2017). Spatiotemporally Controlled Mechanical Cues Drive Progenitor Mesenchymal-to-Epithelial Transition Enabling Proper Heart Formation and Function. Current Biology 27: 1326-1335.
Kaneshima T., Ogawa M., Yamamoto T., Tsuboyama Y., Miyata Y., Kotani T., Okajima T., Michiue T. (2024). Enhancement of neural crest formation by mechanical force in Xenopus development . The International Journal of Developmental Biology 68: 25-37.
Leung A. W., Kent Morest D., Li J. Y.H. (2013). Differential BMP signaling controls formation and differentiation of multipotent preplacodal ectoderm progenitors from human embryonic stem cells. Developmental Biology 379: 208-220.
Li R., Beebe T., Jen N., Yu F., Takabe W., Harrison M., Cao H., Lee J., Yang H., Han P., Wang K., Shimizu H., Chen J., Lien C.L., Chi N. C., Hsiai T. K. (2014). Shear Stress–Activated Wnt-Angiopoietin-2 Signaling Recapitulates Vascular Repair in Zebrafish Embryos. Arteriosclerosis, Thrombosis, and Vascular Biology 34: 2268-2275.
Liu G., David B. T., Trawczynski M., Fessler R. G. (2020). Advances in Pluripotent Stem Cells: History, Mechanisms, Technologies, and Applications. Stem Cell Reviews and Reports 16: 3-32.
Maître J.L., Turlier H., Illukkumbura R., Eismann B., Niwayama R., Nédélec F., Hiiragi T. (2016). Asymmetric division of contractile domains couples cell positioning and fate specification. Nature 536: 344-348.
Matsuoka A. J., Morrissey Z. D., Zhang C., Homma K., Belmadani A., Miller C. A., Chadly D. M., Kobayashi S., Edelbrock A. N., Tanaka-Matakatsu M., Whitlon D. S., Lyass L., McGuire T. L., Stupp S. I., Kessler J. A. (2017). Directed Differentiation of Human Embryonic Stem Cells Toward Placode-Derived Spiral Ganglion-Like Sensory Neurons. Stem Cells Translational Medicine 6: 923-936.
Moody S. A., LaMantia A.S. (2015). Transcriptional Regulation of Cranial Sensory Placode Development. In Neural Crest and Placodes. Elsevier.
Muncie J. M., Ayad N. M.E., Lakins J. N., Xue X., Fu J., Weaver V. M. (2020). Mechanical Tension Promotes Formation of Gastrulation-like Nodes and Patterns Mesoderm Specification in Human Embryonic Stem Cells. Developmental Cell 55: 679-694.e11.
Nat R., (2016). From Human Pluripotent Stem Cells to Peripheral Neurons. In Pluripotent Stem Cells - From the Bench to the Clinic. InTech.
Neidlinger‐Wilke C., Grood E. S., Wang J. H.C., Brand R. A., Claes L. (2001). Cell alignment is induced by cyclic changes in cell length: studies of cells grown in cyclically stretched substrates. Journal of Orthopaedic Research 19: 286-293.
Nihei Y., Ito D., Okada Y., Akamatsu W., Yagi T., Yoshizaki T., Okano H., Suzuki N. (2013). Enhanced Aggregation of Androgen Receptor in Induced Pluripotent Stem Cell-derived Neurons from Spinal and Bulbar Muscular Atrophy. Journal of Biological Chemistry 288: 8043-8052.
Ninomiya H., Mizuno K., Terada R., Miura T., Ohnuma K., Takahashi S., Asashima M., Michiue T. (2015). Improved efficiency of definitive endoderm induction from human induced pluripotent stem cells in feeder and serum-free culture system. In Vitro Cellular & Developmental Biology - Animal 51: 1-8.
Okura K., Matsumoto T., Narita A., Tatsumi H. (2023). Mechanical Stress Decreases the Amplitude of Twisting and Bending Fluctuations of Actin Filaments. Journal of Molecular Biology 435: 168295.
Przybyla L., Lakins J. N., Weaver V. M. (2016). Tissue Mechanics Orchestrate Wnt-Dependent Human Embryonic Stem Cell Differentiation. Cell Stem Cell 19: 462-475.
Rogers C. D., Moody S. A., Casey E. S. (2009). Neural induction and factors that stabilize a neural fate. Birth Defects Research Part C: Embryo Today: Reviews 87: 249-262.
Rogers K. W., Schier A. F. (2011). Morphogen Gradients: From Generation to Interpretation. Annual Review of Cell and Developmental Biology 27: 377-407.
Rubin J., Rubin C., Jacobs C. R. (2006). Molecular pathways mediating mechanical signaling in bone. Gene 367: 1-16.
Sadler T.W. (2005). Embryology of neural tube development. American Journal of Medical Genetics Part C: Seminars in Medical Genetics 135C: 2-8.
Samuel M. S., Lopez J. I., McGhee E. J., Croft D. R., Strachan D., Timpson P., Munro J., Schröder E., Zhou J., Brunton V. G., Barker N., Clevers H., Sansom O. J., Anderson K. I., Weaver V. M., Olson M. F. (2011). Actomyosin-Mediated Cellular Tension Drives Increased Tissue Stiffness and β-Catenin Activation to Induce Epidermal Hyperplasia and Tumor Growth. Cancer Cell 19: 776-791.
Sato K., Adachi T., Matsuo M., Tomita Y. (2005). Quantitative evaluation of threshold fiber strain that induces reorganization of cytoskeletal actin fiber structure in osteoblastic cells. Journal of Biomechanics 38: 1895-1901.
Sato S., Ikeda K., Shioi G., Ochi H., Ogino H., Yajima H., Kawakami K. (2010). Conserved expression of mouse Six1 in the pre-placodal region (PPR) and identification of an enhancer for the rostral PPR. Developmental Biology 344: 158-171.
Schlosser G. (2014). Early embryonic specification of vertebrate cranial placodes. WIREs Developmental Biology 3: 349-363.
Schlosser G. (2010). Making Senses. In . Elsevier.
Sen I. M., Jangra K., (2023). Neural Tube Development and Defects: Meningocele, Encephalocele, Hydrocephalus. In Clinical Anesthesia for the Newborn and the Neonate. (Ed. Saha U., ) Springer, Singapore.
Simões-Costa M., Bronner M. E. (2015). Establishing neural crest identity: a gene regulatory recipe. Development 142: 242-257.
Singh S., Groves A. K. (2016). The molecular basis of craniofacial placode development. WIREs Developmental Biology 5: 363-376.
Stern C. D. (2005). Neural induction: old problem, new findings, yet more questions. Development 132: 2007-2021.
Streit A. (2004). Early development of the cranial sensory nervous system: from a common field to individual placodes. Developmental Biology 276: 1-15.
Tchieu J., Zimmer B., Fattahi F., Amin S., Zeltner N., Chen S., Studer L. (2017). A Modular Platform for Differentiation of Human PSCs into All Major Ectodermal Lineages. Cell Stem Cell 21: 399-410.e7.
Thiery A. P., Buzzi A. L., Hamrud E., Cheshire C., Luscombe N. M., Briscoe J., Streit A., (2023). scRNA-sequencing in chick suggests a probabilistic model for cell fate allocation at the neural plate border. eLife 12: .
Tsukano K., Yamamoto T., Watanabe T., Michiue T. (2022). Xenopus Dusp6 modulates FGF signaling to precisely pattern pre-placodal ectoderm. Developmental Biology 488: 81-90.
Xue X., Sun Y., Resto-Irizarry A. M., Yuan Y., Aw Yong K. M., Zheng Y., Weng S., Shao Y., Chai Y., Studer L., Fu J. (2018). Mechanics-guided embryonic patterning of neuroectoderm tissue from human pluripotent stem cells. Nature Materials 17: 633-641.
Zhou J., Khodakov D. A., Ellis A. V., Voelcker N. H. (2012). Surface modification for PDMS‐based microfluidic devices. Electrophoresis 33: 89-104.