Int. J. Dev. Biol. 68: 223 - 230 (2024)
Special Issue: Developmental Biology in Nordic Countries
The GLI code controls HNF1A levels during foregut differentiation
Open Access | Original Article | Published: 17 January 2024
Abstract
Differentiation of human induced pluripotent stem cells towards pancreatic islet endocrine cells is a complex process, involving the stepwise modulation of key developmental pathways, such as the Hedgehog signaling inhibition during early differentiation stages. In tandem with this active inhibition, key transcription factors for the islet endocrine cell fate, such as HNF1A, show specific changes in their expression patterns. Here we designed a pilot study aimed at investigating the potential interconnection between HH-signaling inhibition and the increase in the HNF1A expression during early regeneration, by inducing changes in the GLI code. This unveiled a link between the two, where GLI3-R mediated Hedgehog target genes inhibition is apparently required for HNF1A efficient expression.
Keywords
foregut differentiation, hiPSC, pancreatic progenitors, GLI, HNF1A
Introduction
Differentiation of human induced pluripotent stem cells (hiPSC) towards pancreatic islet endocrine cell types requires a stepwise sequence of events mimicking pancreas development. Along this sequence progression, key transcription factors are modulated, essentially contributing to the acquisition of the endocrine phenotypes. Amongst these factors, HNF1A is key factor for the early differentiation towards pancreas progenitors as well as for the insulin-secreting beta-cell functionality. Diverse heterozygous mutations in the HNF1A gene cause the most prevalent form of monogenic diabetes in humans, HNF1A-MODY (or MODY3, Monogenic Diabetes of the Young) (Yamagata et al., 1996, Bjørkhaug et al., 2003), characterized by changes in the islet architecture, decreased beta-cell mass, and functionality (Okita et al., 1999, Vesterhus et al., 2008, Servitja et al., 2009). The emergence and increase of HNF1A expression during guided differentiation (Cardenas-Diaz et al., 2019, Cujba et al., 2022, González et al., 2022) coincide to a period in which the Hedgehog signaling pathway (HH-signaling) is actively inhibited using antagonists of Smoothened (SMO) receptor (Kim and Melton, 1998, Rezania et al., 2014, Nostro et al., 2015), a key component of the signaling.
During pancreas development the HH-signaling modulations plays an essential role, its inactivation being absolutely required for pancreas organogenesis (Xuan et al., 2016), even slight ectopic activation compromising this process (Kawahira et al., 2003, Kawahira et al., 2005). Moreover, the pathway also plays a role in adult pancreas regeneration, its inactivation promoting regenerative cell conversion events (Cigliola et al., 2018). The HH-signaling cascade is complex and is mediated by the combinatorial activity of the GLI members (GLI1, GLI2, GLI3 (Sabol et al., 2018)). Briefly, in the absence of HH ligands, the activity of the SMO receptor is inhibited by Patched (PTCH), leading to a sequence of events that culminates with the phosphorylation and partial degradation of the full length GLI2-FL and GLI3-FL and the generation of GLI3-R and GLI2-R transcriptional repressors, which actively repress HH-signaling activity. In contrast with GLI2-R, whose processing is strongly context-dependent, GLI3-R is very stable and acts as a strong repressor of the HH-signaling target genes (Matissek and Elsawa, 2020), its loss being sufficient for the constitutive activation of the pathway, even in the absence of the HH ligands or SMO (Litingtung et al., 2002, Hu et al., 2006, Wang et al., 2007, Wang et al., 2010). Conversely, in the presence of HH ligands, SMO is released from the PTCH inhibition which prevents the phosphorylation (Chen and Jiang, 2013) and processing of the GLI2 and GLI3, which retain their full-length form (GLI2-FL, GLI3-FL). This allows the further transcription of GLI1, the key transcriptional activator of the pathway, thus promoting an amplifying feedback loop. Importantly, the GLIs and their activated and repressor forms recognize the same DNA motifs, competing for the same binding sites. Thus, the HH-signaling transcriptional output is determined by the balance between the different GLI combinations and their repressor or activator states, a situation known as the GLI code (Ruiz i Altaba et al., 2007, Aberger and Ruiz i Altaba, 2014, Chaudhry et al., 2017, Sabol et al., 2018, Zhou and Jiang, 2022).
Despite both being essential events and being actively regulated during the same period during differentiation, it is unclear if the inhibition of HH-signaling and increase of HNF1A are interconnected. In this forthright pilot study, we investigated this relationship by changing the GLI code during early differentiation and assessing HNF1A acquisition in differentiating cells. The results indicated a potential link between the two processes, which deserves a further and more comprehensive investigation.
Results
To analyze the potential connection between the Hedgehog Signaling pathway (HH-signaling) inhibition effected between the stages 3 [S3] and 5 [S5] of differentiation and the regulation of HNF1A expression observed during the same timeframe, hiPSC were differentiated using a protocol developed by Rezania. et al., (Rezania et al., 2014), with minor modifications (Ghila et al., 2021b) (Fig. 1A).
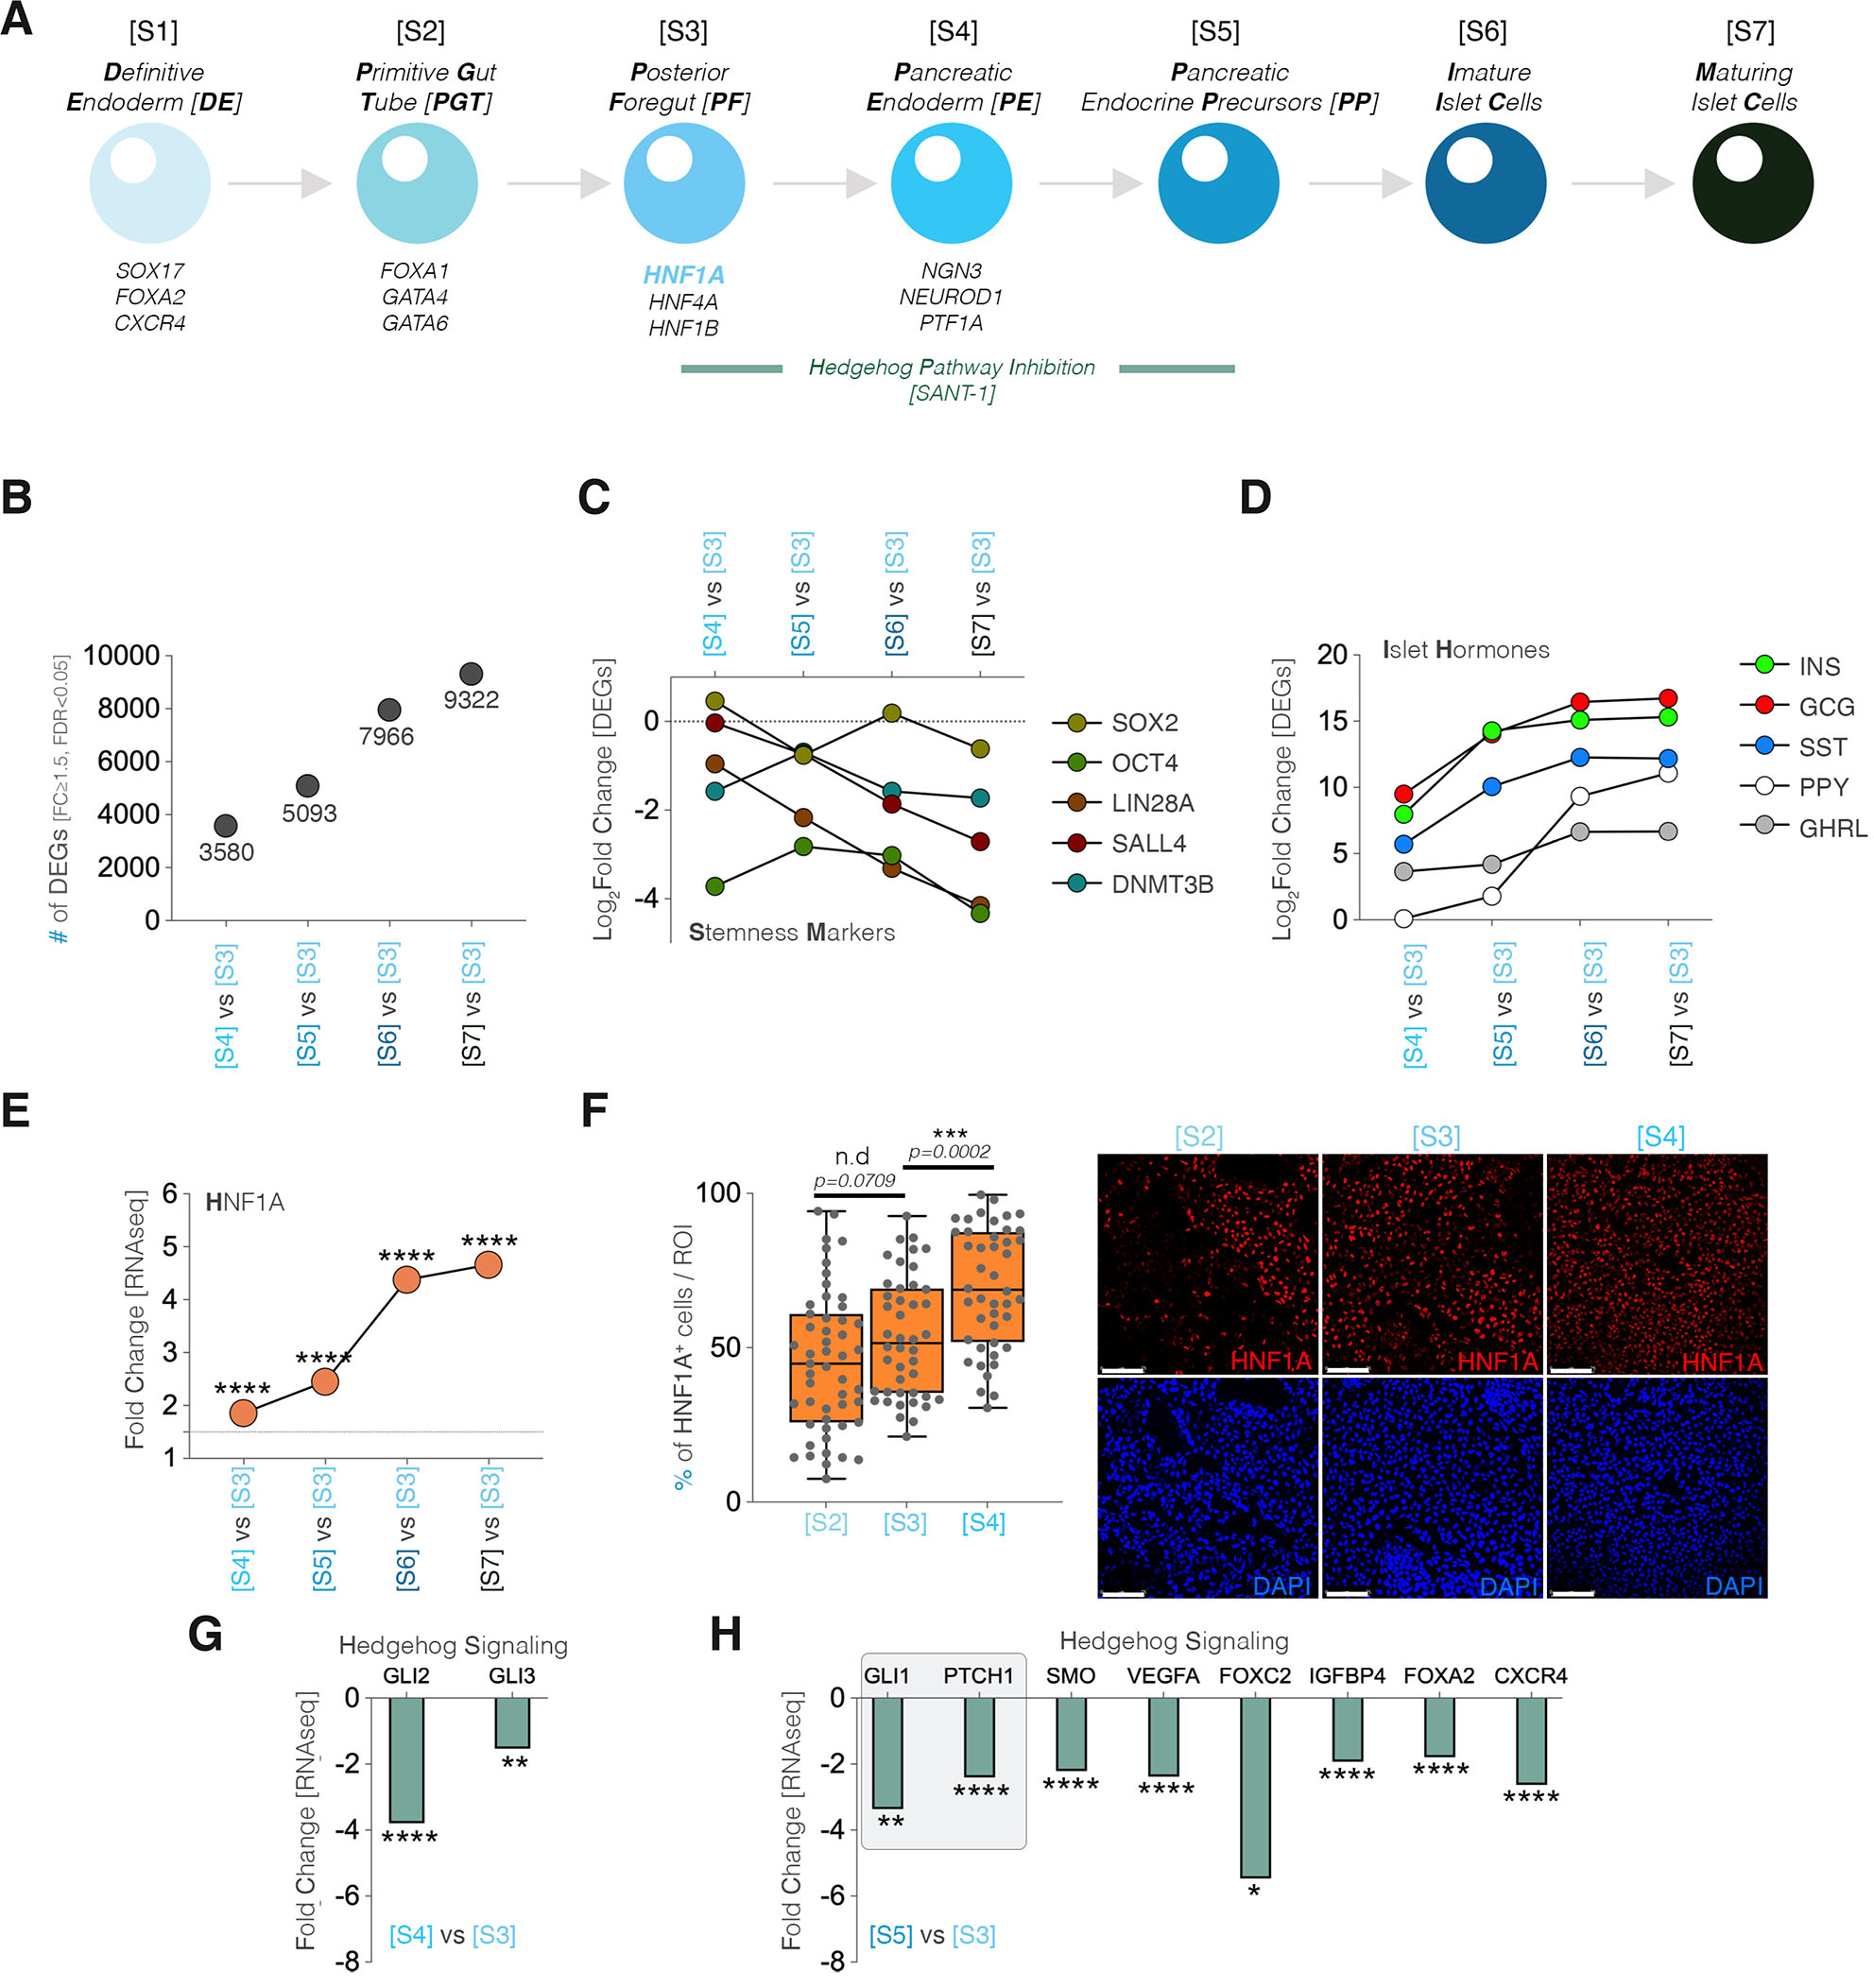
Fig. 1. The HNF1A regulation and Hedgehog-signaling pathway during standard hiPSC differentiation to islet endocrine cells.
(A) Scheme depicting the stages of hiPSC differentiation, the typical stage-specific transcription regulators and the period of SANT-1 induced inhibition of HH-signaling (green segment). (B) Graph representing the number of differentially expressed genes (DEGs, FC≥1.5, FDR<0.05) during the progression of differentiation. (C) Timeline of stemness marker expression. (D) Timeline of pancreatic islet hormone expression. (E) HNF1A expression dynamics revealed by RNAseq analysis. (F) Number of cells expressing HNF1A per region of interest during stages 2, 3 and 4 of differentiation and representative immunofluorescence images (Scale 75 µm; sum of n=10 confocal fields in 3 independent differentiation experiments). (G) Levels of GLI2 and GLI3 expression between [S4] and [S3] of differentiation. (H) Levels of expression of different HH-signaling target genes.
We first characterized the transcriptional profile between [S3] (i.e. the initiation stage for HH-signaling inhibition) and all subsequent stages (i.e. up to Stage 7- [S7]) and observed an expected steady increase in the differentially expressed genes (DEGs, FC≥1.5, FDR<0.05) as differentiation progressed (Fig. 1B, from 3580 at [S4] to 9322 DEGs at [S7] as compared to [S3]). Moreover, key stemness markers, such as SOX2, OCT4 (POU5F1) or SALL4 were downregulated in a stage-wise fashion (Fig. 1C). In contrast, the pancreatic islet hormones (Insulin – INS, Glucagon – GCG, Somatostatin – SST, Pancreatic Polypeptide – PPY and Ghrelin – GHRL) were upregulated with differentiation progression (Fig. 1D).
Furthermore, the HNF1A transcription factor was steadily upregulated from stage [S3] onwards (Fig. 1E). In addition, at protein level, immunofluorescence (IF) confirmed a statistically significant increase in the fraction of HNF1A positive (HNF1A+) cells with stage evolution (Fig. 1F). Contrastingly, components of the HH-signaling pathway, such as GLI2 (-3.79x) and GLI3 (-1.53x) were observed downregulated as early as the first period of Smoothened (Smo)-inhibitor SANT-1 administration (Fig. 1G). As expected, the effect of SANT-1 inhibition became unequivocal during the next stage, with key HH-signaling target genes, known markers of its activation/inhibition, such as GLI1 (-3.36x) and PTCH1 (-2.41x) amongst others, presented a downregulation pattern (Fig. 1H).
Pathway analyses infers a link between HNF1A and HH-signaling
We further explored by pathway analysis the SMO-induced inhibition of the HH-signaling pathway stages ([S3] to [S5]). The analysis revealed one top causal network inferring the HH-signaling inactivation and linking it, indirectly, to HNF1A regulation (p-value of overlap =2.30E-73, activation z-score = -2.854) as early as the first SANT-1 SMO-inhibition period ([S3] to [S4], Fig. 2A). Furthermore, by the end of the SANT-1 treatment period GLI1 was inferred in the top predicted upstream transcriptional regulators of the analyzed landscape (Fig. 2B), while the top causal network (p-value of overlap =1.83E-99, activation z-score = -2.733) associated once more HH-signaling inactivation with HNF1A upregulation via indirect association (Fig. 2C). These data suggest a potential link, though indirect, between HH-signaling activity pattern and HNF1A levels.
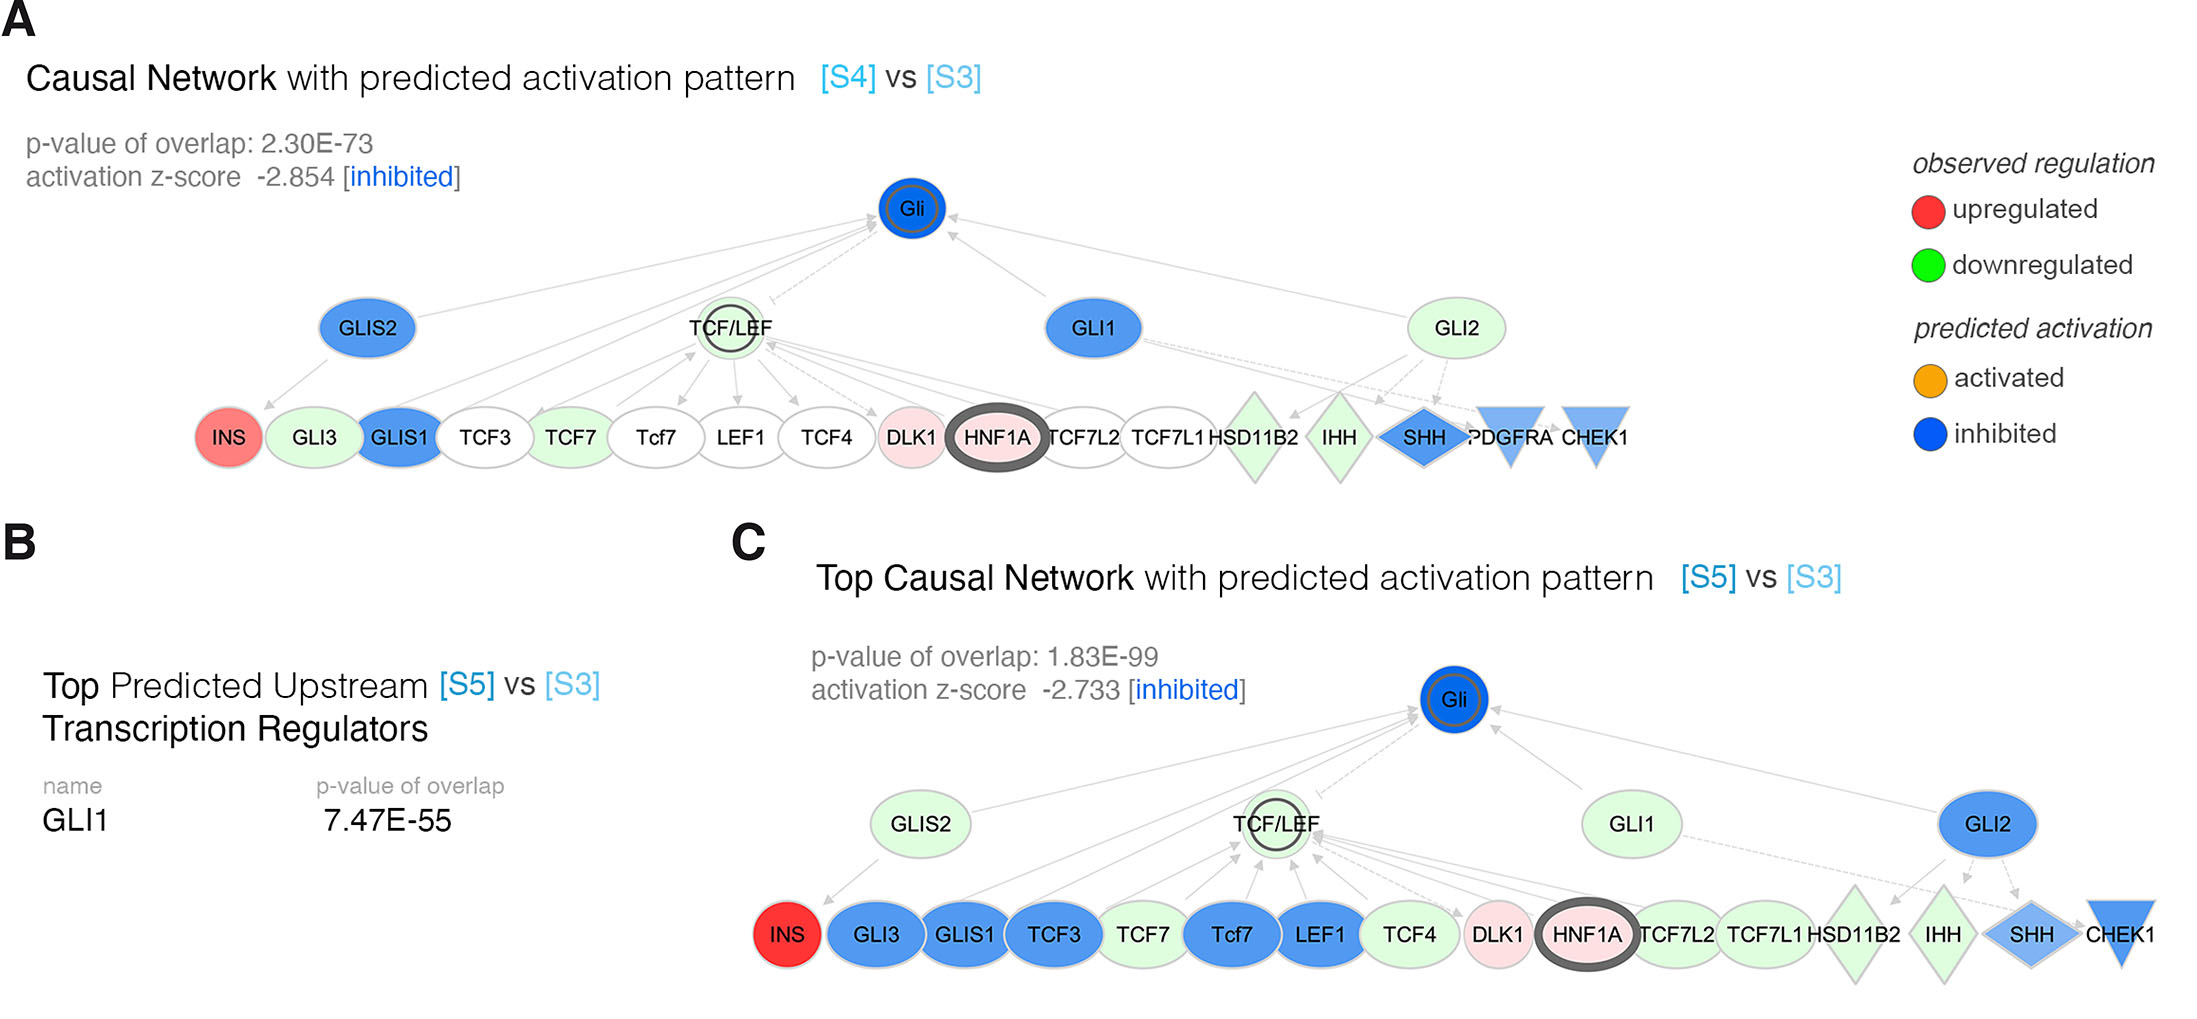
Fig. 2. Pathway analysis of the transcriptional landscape of the differentiation period characterized by hedgehog-signaling inhibition.
(A) Causal network characterizing the differential transcriptional landscape between [S4] and [S3]. (B) The top predicted upstream transcriptional regulator with predicted inhibition. (C) The top causal network characterizing the differential transcriptional landscape between [S5] and [S3].
HNF1A expression and protein levels are regulated by changes in the GLI code during posterior foregut induction
To explore the connection between HNF1A and HH-signaling, we replaced the SANT-1 Smo-inhibitor (standard differentiation) with a different class of antagonist, GANT-58 (Lauth et al., 2007) at the same stage ([S3], Fig. 3A). In contrast to SANT-1, GANT-58 specifically inhibits the GLI1 and GLI2 effectors of the HH-signaling and promotes their accumulation into the nucleus (Lauth et al., 2007, Stanton BZ, 2010). Consequently, while GANT-58 alleviates the activity of GLI1 and GLI2, it will not affect GLI3 transcriptional, neither as GLI3R nor GLI3FL. Thus, SMO-dependent signaling activity will still control GLI3 stability (Fig. 3B). Importantly, through its inhibition on SMO-receptor, SANT-1 affects the activation of all GLIs. However, it is unable to prevent a possible GLI1 or GLI2 activation by downstream SMO-independent, mechanisms, such as the ones involving the mTOR signaling pathway. Thus, the two drugs’ effects on the GLI code are expected to be different (Fig. 3B). Of note, the complete removal of a HH-signaling inhibitor is not possible due to the requirement of SHH-signaling inhibition for differentiation towards the pancreatic cell lineage (Apelqvist et al., 1997, Hebrok et al., 1998) and expression of critical developmental factors for the development of the pancreas, such as Pdx1 (Hebrok et al., 1998).
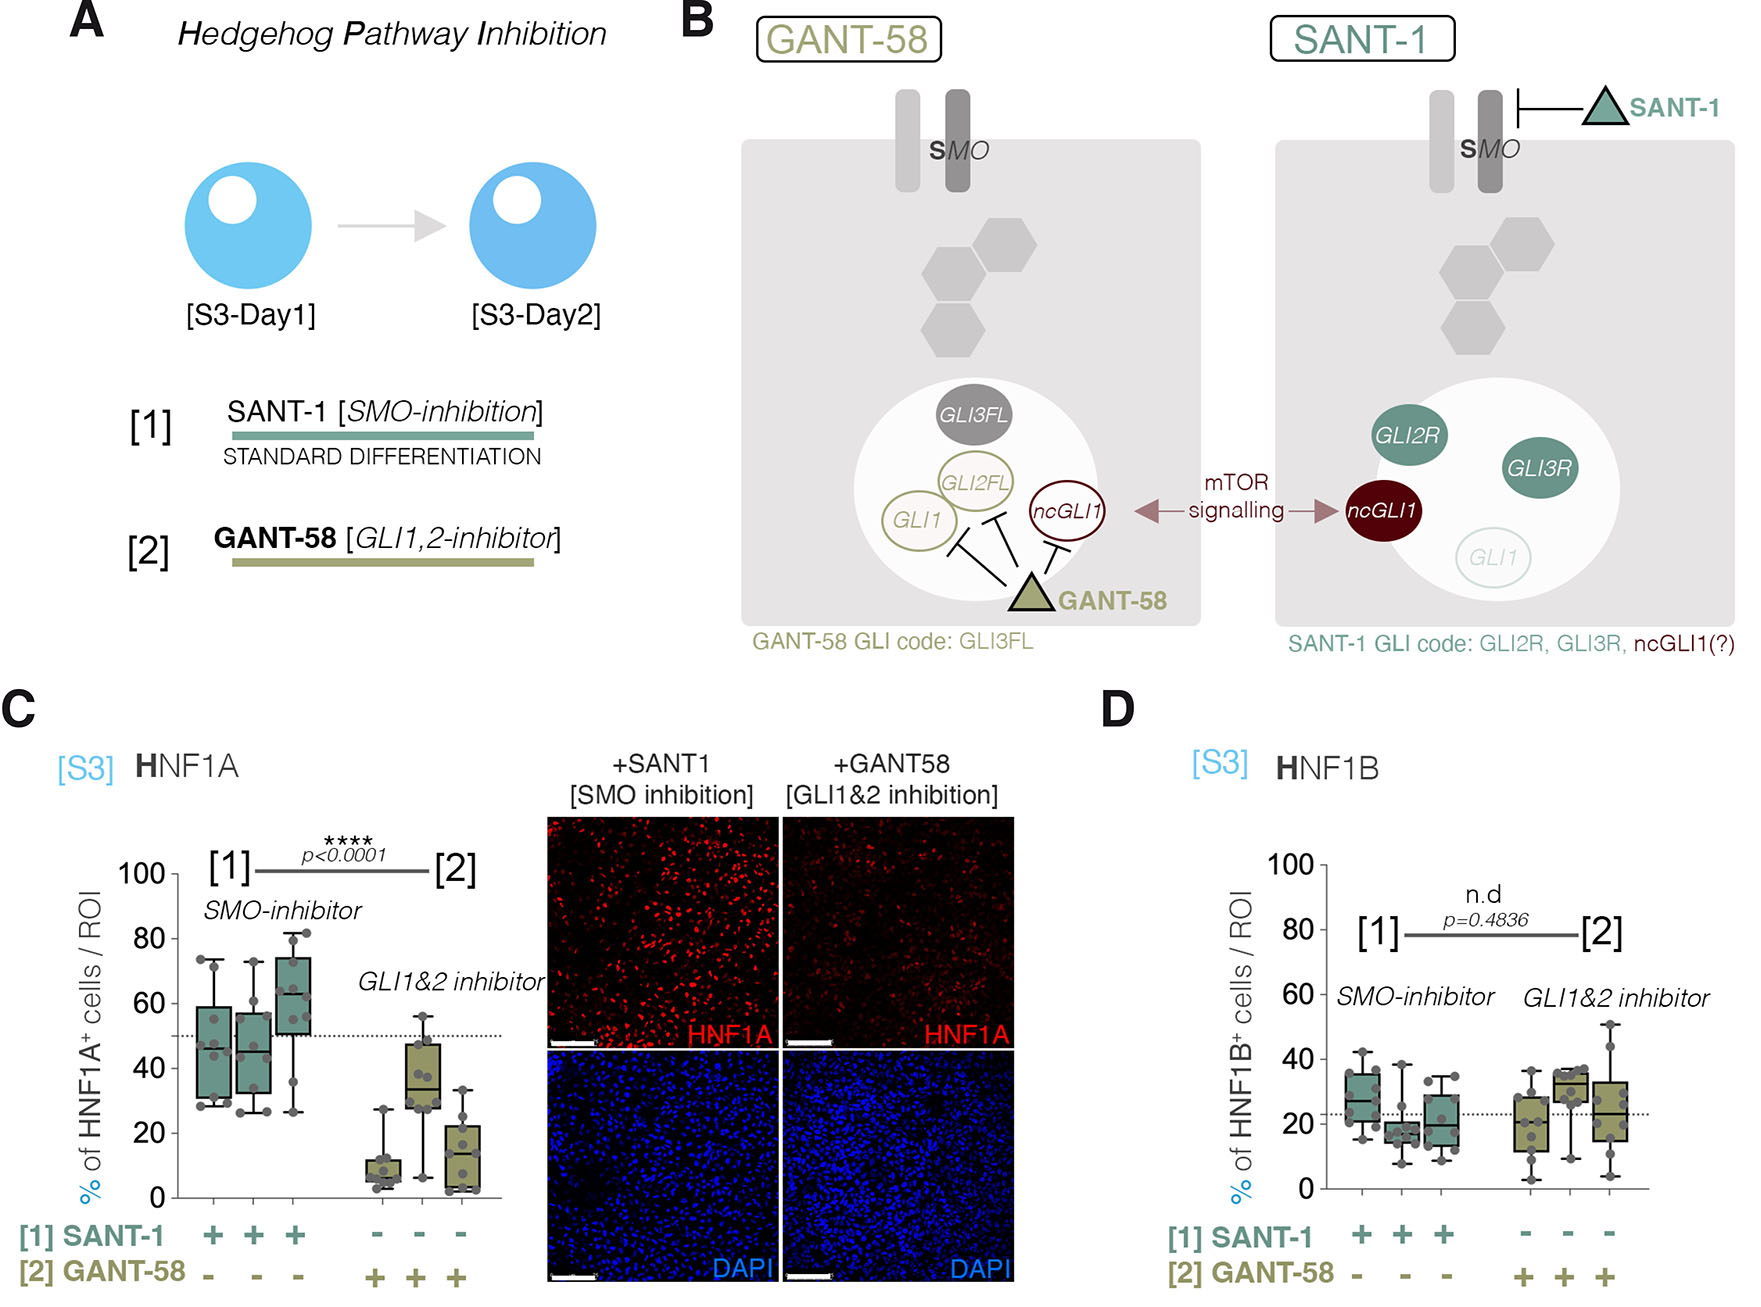
Fig. 3. Alternative hedgehog-signaling inhibition.
(A) The SANT-1 / GANT-58 experimental setup. (B) SANT-1 and GANT-1 specific inhibition targets and the resulting GLI code. (C) The number of cells expressing HNF1A per region of interest following SANT-1 and GANT-58 HH-signaling inhibition, as well as representative immunofluorescence images (Scale bars: 75µm, n=10 confocal fields, each column represents an independent differentiation experiment). (D) The number of cells expressing HNF1B per region of interest following SANT-1 and GANT-58 HH-signaling inhibition (n=10 confocal fields, each column represents an independent differentiation experiment).
The GANT-58 inhibition strongly decreased the percentage of HNF1A+ cells (Fig. 3C), which suggests, considering the SANT-inhibitor GLI code (GLI2R, GLI3R, possible non-canonical GLI1), that the observed HNF1A increase is dependent either on the repressive activity of GLI2R, GLI3R or the increase in GLI1 activity via non-canonical GLI1 activation (Lauth and Toftgard, 2007). To explore if the observed decrease in the fraction of cells expressing HNF1A was caused by cell death or a general impact on transcription, we compared the proportion of cells positive for HNF1B, another HNF factor expressed during the same period, following SANT and GANT inhibition. In contrast with what was observed for HNF1A, the experiment revealed no change in the fraction of HNF1B+ cells, indicating that the effect of HH-signaling inhibition on HNF1A is specific (Fig. 3D).
mTOR-signaling activation antagonizes HNF1A abundance during early differentiation
To investigate if the potential non canonical GLI1 activation impacts HNF1A levels, we targeted the mTOR-signaling pathway, a known transducer of non-canonical GLI1 activity, especially in the context of cancers, where the crosstalk between the HH- and mTOR-signaling was demonstrated to be extremely potent (Wang et al., 2012, Brechbiel et al., 2014). To inactivate the pathway, we used specific Gapmers against the MTOR gene (Fig. 4 A,B) and transfected them at the same stage as before ([S3]). Although the MTOR silencing was inefficient (~60%, Fig. 4C), the proportion of HNF1A+ cells increased upon MTOR inhibition (Fig. 4D). Conversely, even a modest increase in the MTOR pathway activation by using the MHY1485 agonist triggered a decrease in HNF1A expression. These data suggest that mTOR-signaling activation antagonizes the HNF1A levels either directly or via non-canonical GLI1 activation. However, as there is no significant increase of either GLI1 gene or mTOR-signaling induced activity at this stage of differentiation ([S3], see Fig. 2A), the effect of mTOR-signaling on HNF1A levels during differentiation is probably GLI1-independent.
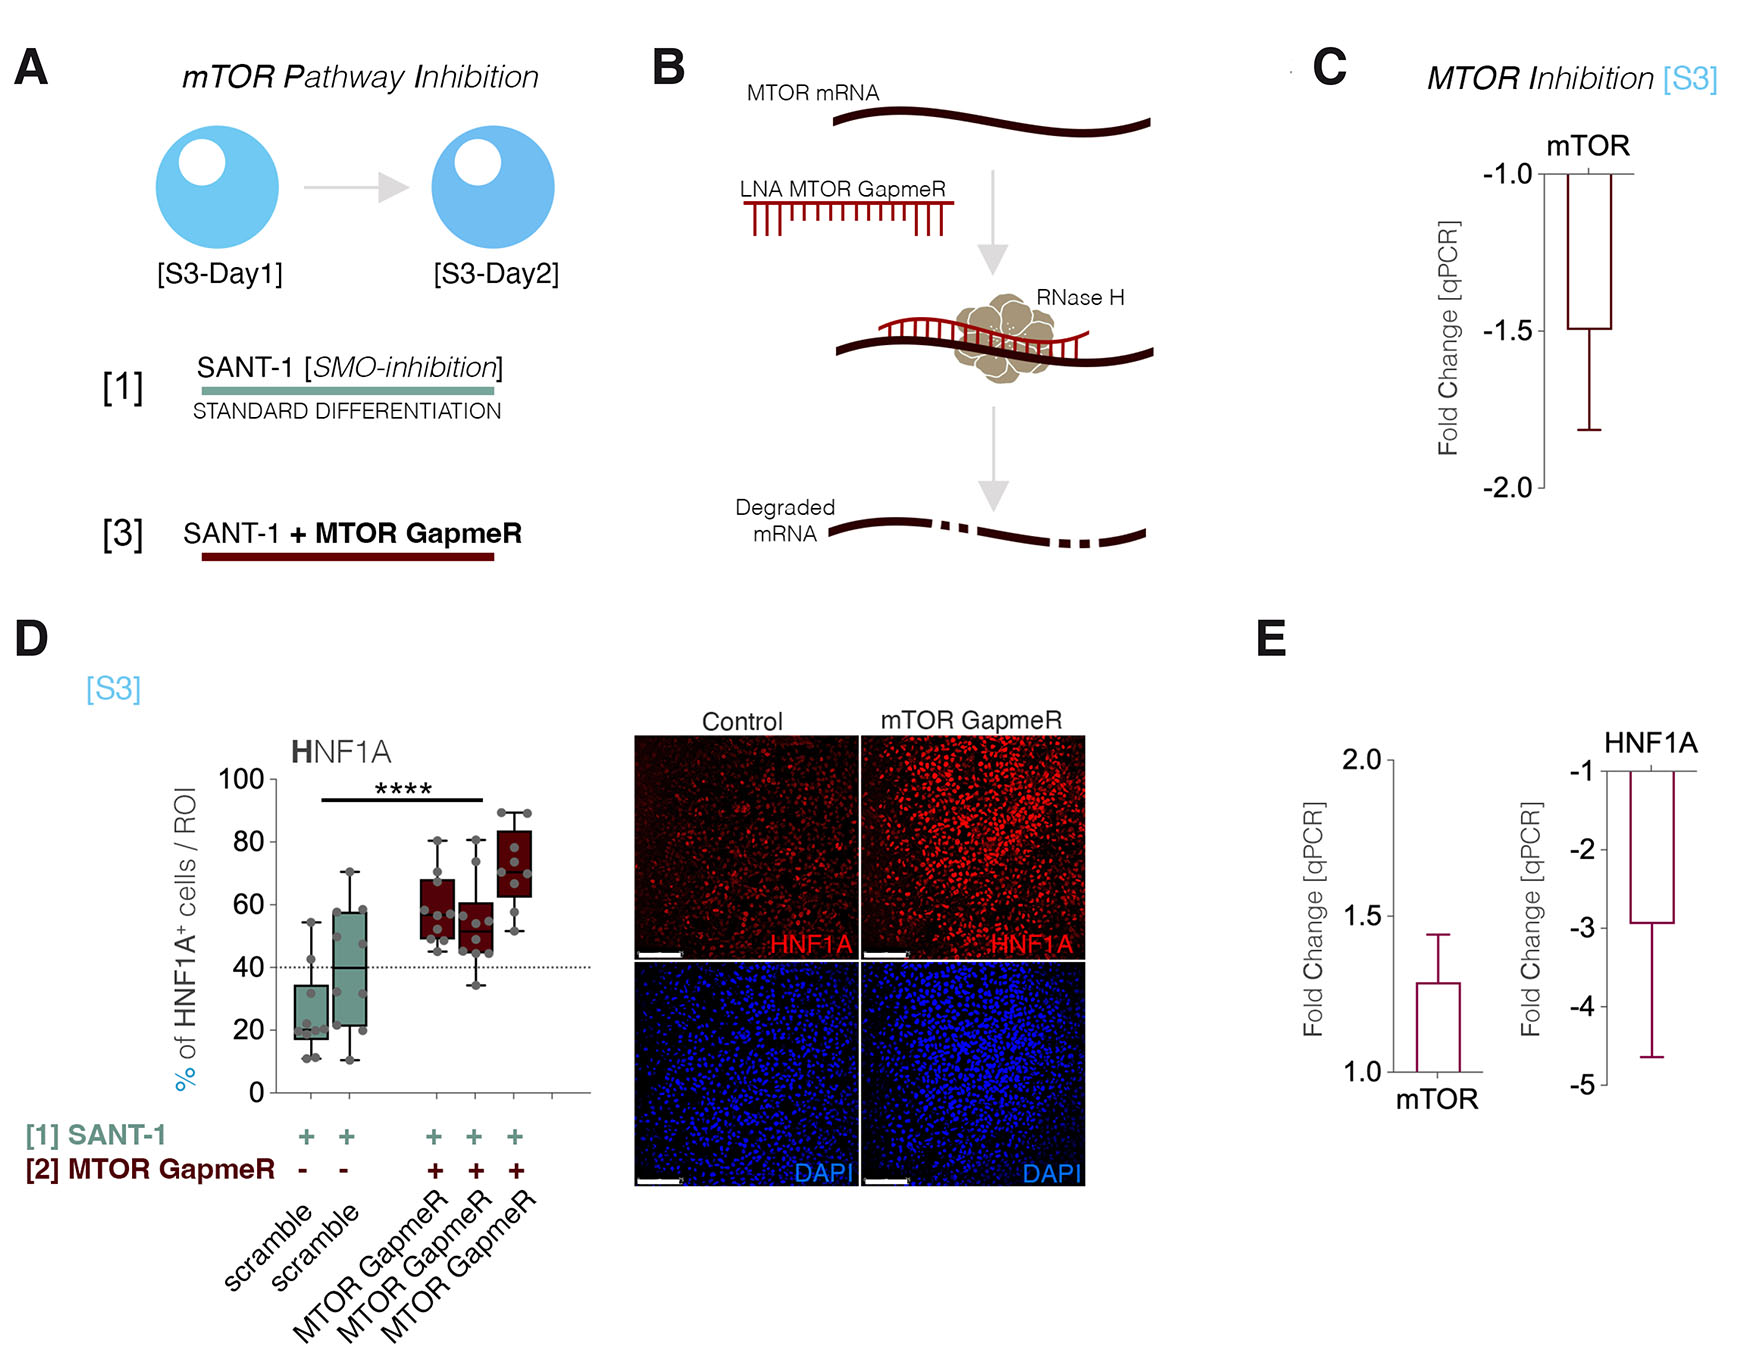
Fig. 4. mTOR-signaling modulations.
(A) Scheme depicting the experimental setup of Gapmer-based mTOR silencing. (B) Scheme depicting the mechanism of action of the mTOR Gapmer. (C) qPCR exhibiting the MTOR expression level following Gapmer-based mTOR silencing. (D) The number of cells expressing HNF1A per region of interest before and after MTOR inhibition (n=10 confocal fields, each column represents an independent differentiation experiment). (E) qPCR exhibiting the expression level of MTOR and HNF1A following mTOR activation by MHY1485 agonist.
Overall, the results suggest that the observed increase in HNF1A during early differentiation is regulated at least partially by HH-signaling, probably through the repressor GLI2R or GLI3R, the output forms of SMO-inhibition by SANT.
Discussion
In this pilot study, we probed the connection between the guided inhibition of HH-signaling during early differentiation and the increase of HNF1A levels by changing the GLI code. The replacement of the SANT-1 SMO-inhibitor with the GANT-58 GLI1/2 inhibitor changed the activation status of GLI3/GLI2 from the repressive GLI3-R/GLI2-R (SMO-inhibition) to the active GLI3-FL/GLI2-FL. This apparently minor modification in the protocol significantly decreased the fraction HNF1A+ of cells by more than half, suggesting that HNF1A expression is susceptible to HH-signaling modulations. As GLI2 is often completely degraded via proteolysis (Pan et al., 2006, Pan and Wang, 2007), it is safe to assume that the observed regulation is mainly mediated by the GLI3 change in activation status, as also reported in other contexts (Hui and Angers, 2011). The negative impact on HNF1A levels observed following the replacement of the GLI3-R by the full-length GLI3-FL, suggests that Gli3-R repressive activity on certain HH-signaling target genes is required for its timely expression. In contrast, another key HNF factor for the development of the pancreas, HNF1B, was not impacted by the induced changes in the GLI code, indicating that this is not a general regulatory mechanism for the HNF factors during pancreas development.
Furthermore, we probed the potential involvement of non-canonical HH-signaling, i.e. SMO-independent (Riobó et al., 2006, Ji et al., 2007, Whisenant et al., 2010, Sabol et al., 2018, Matissek and Elsawa, 2020, Chai et al., 2021, Sigafoos et al., 2021). The past decade revealed the possibility of GLI1 (Nye et al., 2014, Peng et al., 2019), and sometimes GLI2 (Dennler et al., 2009, Javelaud et al., 2011) or GLI3 (Li et al., 2018), regulation via HH-independent mechanism, especially in cancers (Chai et al., 2021). One such example is the mTOR-signaling (Wang et al., 2012, Singh et al., 2017), known to induce GLI1 activation (Kebenko et al., 2015, Singh et al., 2017). During early differentiation, the inhibition of the mTOR-signaling, despite inefficient, elicited a significant increase in the fraction of HNF1A+ cells, however it is unclear if this was a direct effect of the pathway or it was mediated by an increase in GLI1 levels, further research being required to settle this issue.
A clear limitation of this pilot study is the limited readout, restricted at the significant variations in the fraction of cells producing the HNF1A protein. Although this is suitable for establishing an initial link between HH-signaling and HNF1A during early differentiation, mapping the exact regulatory mechanisms will require more rigorous, controlled, and comprehensive characterization. The present study established that such an investigation is worth pursuing. A second limitation is that here we focused only on the short-term effects of the GLI-code changes oh HNF1A levels. A future investigation on the long-term changes in HH-signaling, i.e. spanning the [S3] to [S5] period inhibition, will be required for establishing the extent of its impact on HNF1A and, consequently on the general differentiation efficiency and islet cell fate acquisition.
Materials and Methods
Cell sources
The cell lines used in this study were obtained from Synthego, being commercially available as induced pluripotent stem cells (iPSC) created by retroviral reprogramming of skin fibroblasts from the PGP1 donor from the Personal Genome Project (PGP) (Coriell, GM23338). hiPSCs were maintained on plates coated with Geltrex LDEV-Free Reduced Growth Factor (Gibco, A1413202) in mTeSR Plus cGMP stabilized feeder-free maintenance medium (Stem Cell Technologies, 100-0276). The hiPSCs were passaged using Gentle Cell Dissociation Reagent (StemCell technologies, 100-0485) by fragmenting the existing colonies. The human induced pluripotent stem (hiPSC) cultures were checked regularly for mycoplasma by using MycoAlert Mycoplasm Detection Kit (Lonza, LT07-418) and tested negative prior induction of differentiation.
In vitro differentiation and GLI inhibitors
The hiPSCs were differentiated according to a previously published stepwise protocol (Ghila et al., 2020, Ghila et al., 2021a) starting by seeding 1 500 000 cells/well in Geltrex-coated 6-well plates. For the standard differentiation, 0.25µM SANT1 (Sigma-Aldrich, S4572) was added from Stage 3 to Stage 5 (posterior foregut to pancreatic endocrine precursors). For GLI inhibition, SANT1 was substituted for 0.25µM GANT58 (Sigma-Aldrich, G8923) during Stage 3 (posterior foregut).
mTOR GapmeRs transfection
Differentiating posterior foregut cells (Stage 3) were transfected as previously described (Unger, 2023) with human Antisense LNA MTOR GapmeR (QIAGEN, 339511) using Lipofectamine RNAiMAX (Invitrogen, 13778075) according to manufacturer’s instructions. Briefly, 450 pmol MTOR GapmeRs were used to prepare GapmeRs-RNAiMAX complexes. Following the daily change of differentiation medium, the GapmeRs-RNAiMAX were added, and cells were returned to incubator for the next 24 hours, until the next medium change.
Immunofluorescence staining
Prior to Geltrex coating, 12 mm glass coverslips (VWR, 631-1577) were cleaned and placed in the 6-well plates, then hiPSC were seeded, differentiated, and treated as described above. At specific stages, the coverslips covered by differentiating cells were transferred using tweezers into a clean 12-well plate pre-filled with PBS, and further fixed for 20 minutes in 2% PFA at room temperature. Following several washed with PBS, the unspecific staining was blocked for 30 minutes at room temperature with 2% BSA in PBS. Polyclonal rabbit anti-HNF1A primary antibody (1/100, Abcam, ab204306) was used to detect the endogenous HNF1A-expressing cells, while polyclonal goat anti-HNF1B primary antibody (R+D Systems, AF3330) was used to detect HNF1B-expressing cells. After brief washes in PBS, the coverslips were incubated for 3 hours at room temperature, in dark, with donkey anti-rabbit A647 (1/500, Molecular Probes), or respectively donkey anti-goat A647 (1/500, Molecular Probes) and DAPI nuclear staining (D1306, Molecular Probes). The coverslips were mounted on glass slides using Aqueous Mounting Medium (Abcam, ab128982) and visualized using a Leica TCS SP8 STED 3X (Leica Microsystems) confocal microscope.
Cell counting
Cell counting was performed using supervised automated counting of HNF1A stained nuclei, FIJI (imageJ version 2.9.0). Thresholding was done with “AutoThreshold” using Otsu Dark method on Max projection images from the SP8. Masks were then generated before a ROI was manually drawn around the islet. The number of cells was then counted by the “Analyze particles feature” with a size gating of 10m.
RNA extraction and RT-qPCR
The differentiating cells were collected by using Tryple, centrifuged at 200g for 5 minutes and stored at -80°C until further use. RNA extraction was performed using the RNeasy mini kit following the manufacturer instructions. Additionally, on-column digestion of DNA using DNase 1 was also performed (Qiagen, 79254). The quantity and quality of the eluted RNA was analyzed using Nanodrop One (Thermofisher) and 4150 TapeStation (Agilent, P/N G2992AA). MTOR and HNF1A gene expression was determined using QuantiNova SYBR Green RT-PCR Kit (Qiagen, 208352).
RNA sequencing
Total RNA samples were shipped to Qiagen Genomic Facility, where a second quality control, library preparation, sequencing, and mapping were performed. Data processing and analysis was performed on CLC Genomics Workbench. Fold changes were calculated from the generalized linear model, correcting for differences in library size between the samples and the effects of confounding factors, while “FDR p-values” were calculated using the Benjamini-Hochberg method. Normalized expression values (TPM) for each gene and sample were calculated. The full datasets were deposited to the NCBI Gene Expression Omnibus repository, accession number GSE246049.
Pathway analyses
Differentially expressed gene lists, generated using the CLC genomics workbench (Qiagen), with FC ≥ 1.5 and p < 0.05 were then uploaded to the Ingenuity Pathway Analysis (IPA®, Qiagen) software to generate expression comparison analyses with following parameters: Interaction networks: 35 molecules per network, 25 networks per analysis, causal Networks active; node types: all entities except chemical subclasses; Data sources: All, Species: human.
Statistical analyses
Statistical analyses were performed using GraphPad Prism v9.5.1 (GraphPad Software Inc., USA). RNAseq data were generated with using the Empirical analysis of DGE' algorithm in the CLC Genomics Workbench. FDR corrected p-values were used, with a significance threshold p-value of ≤0.05. We used parametric Welch's t test for the immunofluorescence data quantification. In figures, data are represented as mean ± SD (standard deviation) unless otherwise specified. Statistical significance was defined at P < 0.05 (∗), P < 0.01 (∗∗), P < 0.001 (∗∗∗), and P < 0.0001 (∗∗∗∗).
Acknowledgements
We thank H.A. Dale for confocal assistance. The confocal imaging was performed at the Molecular Imaging Center (MIC), Department of Biomedicine, University of Bergen.
Abbreviations
GLI, glioma-associated oncogene ; HH, hedgehog ; hiPSC, human induced pluripotent stem cell ; HNF, hepatocyte nuclear factor ;Declarations
Author contributions
L.U. performed the differentiation, silencing, immunostaining, confocal imaging, counting; A.F.M. set up the CLC pipeline and generated DEG lists for several transcriptomics comparisons; S.C. performed the pathway analysis for the transcriptomic dataset; T.A.L. contributed to differentiations and cell sorting; L.G. and S.C. conceived the experiments; L.G. interpreted the observations and wrote the manuscript. All authors approved the final version of the manuscript.
Funding
This work was supported by funds from the Research Council of Norway (NFR 314397), Novo Nordic Foundation (NNF21OC0067325) to S.C, Diabetesforbundets forskningsfond to T.A.L. and L.G. The funding sources had no role in the study design, its execution, analyses, interpretation of the data, nor the decision to publish these results.
References
Aberger F., Ruiz i Altaba A. (2014). Context-dependent signal integration by the GLI code: The oncogenic load, pathways, modifiers and implications for cancer therapy. Seminars in Cell & Developmental Biology 33: 93-104.
Apelqvist A., Ahlgren U., Edlund H. (1997). Sonic hedgehog directs specialised mesoderm differentiation in the intestine and pancreas. Current Biology 7: 801-804.
Bjørkhaug L., Sagen J. V., Thorsby P., Søvik O., Molven A., Njølstad P. R. (2003). Hepatocyte Nuclear Factor-1α Gene Mutations and Diabetes in Norway. The Journal of Clinical Endocrinology & Metabolism 88: 920-931.
Brechbiel J., Miller-Moslin K., Adjei A. A. (2014). Crosstalk between hedgehog and other signaling pathways as a basis for combination therapies in cancer. Cancer Treatment Reviews 40: 750-759.
Cardenas-Diaz F. L., Osorio-Quintero C., Diaz-Miranda M. A., Kishore S., Leavens K., Jobaliya C., Stanescu D., Ortiz-Gonzalez X., Yoon C., Chen C. S., Haliyur R., Brissova M., Powers A. C., French D. L., Gadue P. (2019). Modeling Monogenic Diabetes using Human ESCs Reveals Developmental and Metabolic Deficiencies Caused by Mutations in HNF1A. Cell Stem Cell 25: 273-289.e5.
Chai J. Y., Sugumar V., Alshawsh M. A., Wong W. F., Arya A., Chong P. P., Looi C. Y. (2021). The Role of Smoothened-Dependent and -Independent Hedgehog Signaling Pathway in Tumorigenesis. Biomedicines 9: 1188.
Chaudhry P., Singh M., Triche T. J., Guzman M., Merchant A. A. (2017). GLI3 repressor determines Hedgehog pathway activation and is required for response to SMO antagonist glasdegib in AML. Blood 129: 3465-3475.
Chen Y., Jiang J. (2013). Decoding the phosphorylation code in Hedgehog signal transduction. Cell Research 23: 186-200.
Cigliola V., Ghila L., Thorel F., van Gurp L., Baronnier D., Oropeza D., Gupta S., Miyatsuka T., Kaneto H., Magnuson M. A., Osipovich A. B., Sander M., Wright C. E. V., Thomas M. K., Furuyama K., Chera S., Herrera P. L. (2018). Pancreatic islet-autonomous insulin and smoothened-mediated signalling modulate identity changes of glucagon+ α-cells. Nature Cell Biology 20: 1267-1277.
Cujba A.M., Alvarez-Fallas M. E., Pedraza-Arevalo S., Laddach A., Shepherd M. H., Hattersley A. T., Watt F. M., Sancho R. (2022). An HNF1α truncation associated with maturity-onset diabetes of the young impairs pancreatic progenitor differentiation by antagonizing HNF1β function. Cell Reports 38: 110425.
Dennler S., André J., Verrecchia F., Mauviel A. (2009). Cloning of the Human GLI2 Promoter. Journal of Biological Chemistry 284: 31523-31531.
Ghila L., Bjørlykke Y., Legøy T. A., Vethe H., Furuyama K., Chera S., Ræder H. (2020). Bioinformatic Analyses of miRNA–mRNA Signature during hiPSC Differentiation towards Insulin-Producing Cells upon HNF4α Mutation. Biomedicines 8: 179.
Ghila L., Legøy T. A., Chera S. (2021a). A Method for Encapsulation and Transplantation into Diabetic Mice of Human Induced Pluripotent Stem Cells (hiPSC)-Derived Pancreatic Progenitors. In Induced Pluripotent Stem (iPS) Cells. (Ed. Nagy Andras, Turksen Kursad) Springer US, New York, NY.
Ghila L., Legøy T. A., Mathisen A. F., Abadpour S., Paulo J. A., Scholz H., Ræder H., Chera S. (2021b). Chronically Elevated Exogenous Glucose Elicits Antipodal Effects on the Proteome Signature of Differentiating Human iPSC-Derived Pancreatic Progenitors. International Journal of Molecular Sciences 22: 3698.
González B. J., Zhao H., Niu J., Williams D. J., Lee J., Goulbourne C. N., Xing Y., Wang Y., Oberholzer J., Blumenkrantz M. H., Chen X., LeDuc C. A., Chung W. K., Colecraft H. M., Gromada J., Shen Y., Goland R. S., Leibel R. L., Egli D. (2022). Reduced calcium levels and accumulation of abnormal insulin granules in stem cell models of HNF1A deficiency. Communications Biology 5: 779.
Hebrok M., Kim S. K., Melton D. A. (1998). Notochord repression of endodermal Sonic hedgehog permits pancreas development. Genes & Development 12: 1705-1713.
Hu M. C., Mo R., Bhella S., Wilson C. W., Chuang P.T., Hui C., Rosenblum N. D. (2006). GLI3-dependent transcriptional repression of Gli1, Gli2 and kidney patterning genes disrupts renal morphogenesis . Development 133: 569-578.
Hui C., Angers S. (2011). Gli Proteins in Development and Disease. Annual Review of Cell and Developmental Biology 27: 513-537.
Javelaud D., Alexaki V. I., Dennler S., Mohammad K. S., Guise T. A., Mauviel A. (2011). TGF-β/SMAD/GLI2 Signaling Axis in Cancer Progression and Metastasis. Cancer Research 71: 5606-5610.
Ji Z., Mei F. C., Xie J., Cheng X. (2007). Oncogenic KRAS Activates Hedgehog Signaling Pathway in Pancreatic Cancer Cells. Journal of Biological Chemistry 282: 14048-14055.
Kawahira H., Ma N. H., Tzanakakis E. S., McMahon A. P., Chuang P.T., Hebrok M. (2003). Combined activities of hedgehog signaling inhibitors regulate pancreas development. Development 130: 4871-4879.
Kawahira H., Scheel D. W., Smith S. B., German M. S., Hebrok M. (2005). Hedgehog signaling regulates expansion of pancreatic epithelial cells. Developmental Biology 280: 111-121.
Kebenko M., Drenckhan A., Gros S. J., Jücker M., Grabinski N., Ewald F., Grottke A., Schultze A., Izbicki J. R., Bokemeyer C., Wellbrock J., Fiedler W. (2015). ErbB2 signaling activates the Hedgehog pathway via PI3K–Akt in human esophageal adenocarcinoma: Identification of novel targets for concerted therapy concepts. Cellular Signalling 27: 373-381.
Kim S. K., Melton D. A. (1998). Pancreas development is promoted by cyclopamine, a Hedgehog signaling inhibitor. Proceedings of the National Academy of Sciences 95: 13036-13041.
Lauth M., Bergström A., Shimokawa T., Toftgård R. (2007). Inhibition of GLI-mediated transcription and tumor cell growth by small-molecule antagonists. Proceedings of the National Academy of Sciences 104: 8455-8460.
Lauth M., Toftgård R. (2007). Non-Canonical Activation of GLI Transcription Factors: Implications for Targeted Anti-Cancer Therapy. Cell Cycle 6: 2458-2463.
Li N., Truong S., Nouri M., Moore J., Al Nakouzi N., Lubik A. A., Buttyan R. (2018). Non-canonical activation of hedgehog in prostate cancer cells mediated by the interaction of transcriptionally active androgen receptor proteins with Gli3. Oncogene 37: 2313-2325.
Litingtung Y., Dahn R. D., Li Y., Fallon J. F., Chiang C. (2002). Shh and Gli3 are dispensable for limb skeleton formation but regulate digit number and identity. Nature 418: 979-983.
Matissek S. J., Elsawa S. F. (2020). GLI3: a mediator of genetic diseases, development and cancer. Cell Communication and Signaling 18: 54.
Nostro M. C., Sarangi F., Yang C., Holland A., Elefanty A. G., Stanley E. G., Greiner D. L., Keller G. (2015). Efficient Generation of NKX6-1+ Pancreatic Progenitors from Multiple Human Pluripotent Stem Cell Lines. Stem Cell Reports 4: 591-604.
Nye M. D., Almada L. L., Fernandez-Barrena M. G., Marks D. L., Elsawa S. F., Vrabel A., Tolosa E. J., Ellenrieder V., Fernandez-Zapico M. E. (2014). The Transcription Factor GLI1 Interacts with SMAD Proteins to Modulate Transforming Growth Factor β-Induced Gene Expression in a p300/CREB-binding Protein-associated Factor (PCAF)-dependent Manner. Journal of Biological Chemistry 289: 15495-15506.
Okita K., Yang Q., Yamagata K., Hangenfeldt K. A., Miyagawa J., Kajimoto Y., Nakajima H., Namba M., Wollheim C. B., Hanafusa T., Matsuzawa Y. (1999). Human Insulin Gene Is a Target Gene of Hepatocyte Nuclear Factor-1α (HNF-1α) and HNF-1β. Biochemical and Biophysical Research Communications 263: 566-569.
Pan Y., Bai C. B., Joyner A. L., Wang B. (2006). Sonic hedgehog Signaling Regulates Gli2 Transcriptional Activity by Suppressing Its Processing and Degradation. Molecular and Cellular Biology 26: 3365-3377.
Pan Y., Wang B. (2007). A Novel Protein-processing Domain in Gli2 and Gli3 Differentially Blocks Complete Protein Degradation by the Proteasome. Journal of Biological Chemistry 282: 10846-10852.
Peng L., Yang C., Yin J., Ge M., Wang S., Zhang G., Zhang Q., Xu F., Dai Z., Xie L., Li Y., Si J., Ma K. (2019). TGF-β2 Induces Gli1 in a Smad3-Dependent Manner Against Cerebral Ischemia/Reperfusion Injury After Isoflurane Post-conditioning in Rats. Frontiers in Neuroscience 13: 636.
Rezania A., Bruin J. E., Arora P., Rubin A., Batushansky I., Asadi A., O'Dwyer S., Quiskamp N., Mojibian M., Albrecht T., Yang Y. H. C., Johnson J. D., Kieffer T. J. (2014). Reversal of diabetes with insulin-producing cells derived in vitro from human pluripotent stem cells. Nature Biotechnology 32: 1121-1133.
Riobó N. A., Lu K., Ai X., Haines G. M., Emerson C. P. (2006). Phosphoinositide 3-kinase and Akt are essential for Sonic Hedgehog signaling. Proceedings of the National Academy of Sciences 103: 4505-4510.
Ruiz i Altaba A., Mas C., Stecca B. (2007). The Gli code: an information nexus regulating cell fate, stemness and cancer. Trends in Cell Biology 17: 438-447.
Sabol M., Trnski D., Musani V., Ozretić P., Levanat S. (2018). Role of GLI Transcription Factors in Pathogenesis and Their Potential as New Therapeutic Targets. International Journal of Molecular Sciences 19: 2562.
Servitja J.M., Pignatelli M., Maestro M. , Cardalda C., Boj S. F., Lozano J., Blanco E., Lafuente A., McCarthy M. I., Sumoy L., Guigó R., Ferrer J. (2009). Hnf1α (MODY3) Controls Tissue-Specific Transcriptional Programs and Exerts Opposed Effects on Cell Growth in Pancreatic Islets and Liver. Molecular and Cellular Biology 29: 2945-2959.
Sigafoos A. N., Paradise B. D., Fernandez-Zapico M. E. (2021). Hedgehog/GLI Signaling Pathway: Transduction, Regulation, and Implications for Disease. Cancers 13: 3410.
Singh R., Dhanyamraju P. K., Lauth M. (2017). DYRK1B blocks canonical and promotes non-canonical Hedgehog signaling through activation of the mTOR/AKT pathway. Oncotarget 8: 833-845.
Stanton B. Z., Peng L. F. (2010). Small-molecule modulators of the Sonic Hedgehog signaling pathway. Mol. BioSyst. 6: 44-54.
Unger L., Ghila L., Chera S. (2023). Targeted Gene Silencing by Using GapmeRs in Differentiating Human-Induced Pluripotent Stem Cells (hiPSC) Toward Pancreatic Progenitors. In Stem Cells and Lineage Commitment. (Ed. Turksen Kursad) Springer US, New York, NY.
Vesterhus M., Haldorsen I. S., Ræder H., Molven A., Njølstad P. R. (2008). Reduced Pancreatic Volume in Hepatocyte Nuclear Factor 1A-Maturity-Onset Diabetes of the Young. The Journal of Clinical Endocrinology & Metabolism 93: 3505-3509.
Wang C., Pan Y., Wang B. (2010). Suppressor of fused and Spop regulate the stability, processing and function of Gli2 and Gli3 full-length activators but not their repressors. Development 137: 2001-2009.
Wang C., Rüther U., Wang B. (2007). The Shh-independent activator function of the full-length Gli3 protein and its role in vertebrate limb digit patterning. Developmental Biology 305: 460-469.
Wang Y., Ding Q., Yen C.J., Xia W., Izzo J. G., Lang J.Y., Li C.W., Hsu J. L., Miller S. A., Wang X., Lee D.F., Hsu J.M., Huo L., LaBaff A. M., Liu D., Huang T.H., Lai C.C., Tsai F.J., Chang W.C., Chen C.H., Wu T.T., Buttar N. S., Wang K. K., Wu Y., Wang H., Ajani J., Hung M.C. (2012). The Crosstalk of mTOR/S6K1 and Hedgehog Pathways. Cancer Cell 21: 374-387.
Whisenant T. C., Ho D. T., Benz R. W., Rogers J. S., Kaake R. M., Gordon E. A., Huang L., Baldi P., Bardwell L. (2010). Computational Prediction and Experimental Verification of New MAP Kinase Docking Sites and Substrates Including Gli Transcription Factors. PLoS Computational Biology 6: e1000908.
Xuan S., Sussel L. (2016). GATA4 and GATA6 regulate pancreatic endoderm identity through inhibition of hedgehog signaling. Development 143: 780-786.
Yamagata K., Furuta H., Oda N., Kaisaki P. J., Menzel S., Cox N. J., Fajans S. S., Signorini S., Stoffel M., Bell G. I. (1996). Mutations in the hepatocyte nuclear factor-4α gene in maturity-onset diabetes of the young (MODY1). Nature 384: 458-460.
Zhou M., Jiang J. (2022). Gli Phosphorylation Code in Hedgehog Signal Transduction. Frontiers in Cell and Developmental Biology 10: 846927.