Int. J. Dev. Biol. 68: 25 - 37 (2024)
Enhancement of neural crest formation by mechanical force in Xenopus development
Open Access | Original Article | Published: 2 April 2024
Abstract
In vertebrate development, ectoderm is specified into neural plate (NP), neural plate border (NPB), and epidermis. Although such patterning is thought to be achieved by molecular concentration gradients, it has been revealed, mainly by in vitro analysis, that mechanical force can regulate cell specification. During in vivo patterning, cells deform and migrate, and this applies force to surrounding tissues, shaping the embryo. However, the role of mechanical force for cell specification in vivo is largely unknown. In this study, with an aspiration assay and atomic force microscopy, we have demonstrated that tension on ectodermal cells decreases laterally from the midline in Xenopus early neurula. Ectopically applied force laterally expanded the neural crest (NC) region, a derivative of the NPB, whereas force relaxation suppressed it. Furthermore, force application activated both the FGF and Wnt pathways, which are required for NC formation during neuroectodermal patterning. Taken together, mechanical force is necessary for NC formation in order to regulate signaling pathways. Furthermore, molecular signals specify the NP and generate force on neighboring tissue, the NPB, with its closure. This force activates signals, possibly determining the appropriate width of a narrow tissue, the NC.
Keywords
neural crest, ectoderm, FGF, Wnt, Xenopus
Introduction
During animal development, fertilized eggs divide into smaller cells, and these cells are specified into ectoderm, mesoderm, and endoderm. Ectoderm is further specified into three regions, neural plate (NP), neural plate border (NPB), and epidermis. Such neuroectodermal patterning is thought to be achieved by concentration gradients of secreted molecules, including morphogens. Depending on their concentrations, signaling pathways are regulated, and these signaling pathways orchestrate tissue patterning, in what is known as the French flag model (Wolpert, 1969).
In vertebrates, highly activated BMP signaling specifies ectodermal cells into epidermis. When BMP signaling is strongly inhibited by antagonists such as Chordin, ectodermal cells are specified into NP (Bouwmeester et al., 1996; Lamb et al., 1993; Sasai et al., 1994). An intermediate level of activation of BMP signaling induces NPB in a narrow U-shaped region between NP and epidermis, in concert with Wnt and FGF signaling (Ahrens and Schlosser, 2005; Brugmann et al., 2004; Kwon et al., 2010; Litsiou et al., 2005; Mayor et al., 1995; Milet and Monsoro-Burq, 2012; Pla and Monsoro-Burq, 2018). Lateral NPB is specified into neural crest (NC), while anterior NPB is specified into pre-placodal ectoderm (PPE). Transcription factors, Pax3 and Zic1, induce NC genes from the late gastrula stage (around stage 12) (Aybar et al., 2003; Hong and Saint-Jeannet, 2007; Mayor et al., 1995; Sasai et al., 2001; Sato et al., 2005) in concert with Wnt signaling activation induced by the paraxial mesoderm (Garcı́a-Castro et al., 2002; Litsiou et al., 2005). FGF signaling is also required for NC induction, which indirectly induces NC by enhancing Wnt8 expression (Hong et al., 2008). After the gastrula stage, activation of both BMP and Wnt signaling is also required for maintenance and induction of NC gene expression (Steventon et al., 2009; Thiery et al., 2023).
Not only molecular signals, but also mechanical signals regulate cell specification. For instance, mesenchymal stem cells determine cell fate in response to stiffness of culture substrate (Engler et al., 2006). In mouse embryonic stem cells, mechanical stimulation enlarges nuclear pores and promotes nuclear translocation of YAP protein to activate the Hippo pathway (Elosegui-Artola et al., 2017). Applying tension to human ectodermal stem cells in vitro activates BMP signaling and enhances NPB specification (Xue et al., 2018). With respect to embryogenesis, centrifugation or tissue extension activates FGF signaling in a ligand-independent manner during the Xenopus gastrula stage (Kinoshita et al., 2020). Mechanical stimulation causes cytoplasmic ZO-1 to migrate to adherence junctions in Xenopus and mouse embryos (Hashimoto et al., 2019; Kinoshita et al., 2020; Kinoshita et al., 2022). Thus, mechanical stimulation can regulate signaling activity or protein localization. However, considering that these previous studies tested excessive stimulation, such that cell area was extended several folds, it was still largely unknown whether minute in vivo force regulates cell specification.
During in vivo morphogenesis, mechanical force is generated, as in gastrulation movement or neural tube closure (Heisenberg and Bellaïche, 2013). During neural tube closure, the flat sheet of NP is bent, and both sides of the neural fold are rolled up to fuse at the midline, and this process is achieved by three physical events, apical constriction, cell elongation, and cell migration (Inoue et al., 2016; Morita et al., 2012; Suzuki et al., 2012). Our previous studies using non-invasive tension sensor probes have shown that NP cells are under greater tension than epidermal cells during Xenopus neural tube closure (Hirano et al., 2018; Yamashita et al., 2016). In addition, we found that there is a gradient of tension along the antero-posterior axis in Xenopus neurula by acquiring Young’s modulus using atomic force microscopy (AFM), and this gradient assists planar cell polarity formation (Hirano et al., 2022). However, the relationship between neuroectodermal patterning and mechanical stimulation is still largely unknown in vivo.
In this study, to understand the role of mechanical stimulation in neuroectodermal patterning, we examined mechanical properties of Xenopus ectoderm using an aspiration assay and AFM. To examine whether mechanical force is involved in neuroectodermal patterning, we employed the following methods to modulate mechanical force. Excessive mechanical force was applied to whole embryos by centrifugation, and in vivo magnitude tension was applied by inducing ectopic cell contraction. We also invasively relaxed ectodermal tension by cutting tissue, and non-invasively relaxed tension by myosin inhibition and phospholipid scrambling. These experiments showed that mechanical stimulation is necessary in neuroectodermal patterning.
Results
Tension of ectodermal cells decreases laterally from the midline in early Xenopus neurula
To directly measure mechanical properties during neuroectodermal patterning, we performed an aspiration assay (Kimura-Yoshida et al., 2018). A glass needle was placed in contact with Xenopus embryos at the late gastrula stage and early neurula stage, when folding of NP is thought to generate tension in ectoderm, and constant suction (negative pressure) was applied. We measured length of the aspirated tissues in the needle (Fig. 1A, Fig. S1A) at five positions (Fig. 1B, Fig. S1C). Aspirated length was smallest on the midline, and increased laterally at late gastrula stage (st. 12) (Fig. S1D) and early neurula stages (st. 13 and 14) (Fig. 1 C,D), and the difference between positions was higher at the later stage. To verify which tissue was aspirated, we prepared a hemi-section of embryos fixed during aspiration, and found that two layers of ectoderm deformed, while deformation of underlying mesoderm was slight (Fig. S1B). This suggests that the length of aspirated tissue mainly reflects mechanical properties of ectoderm.
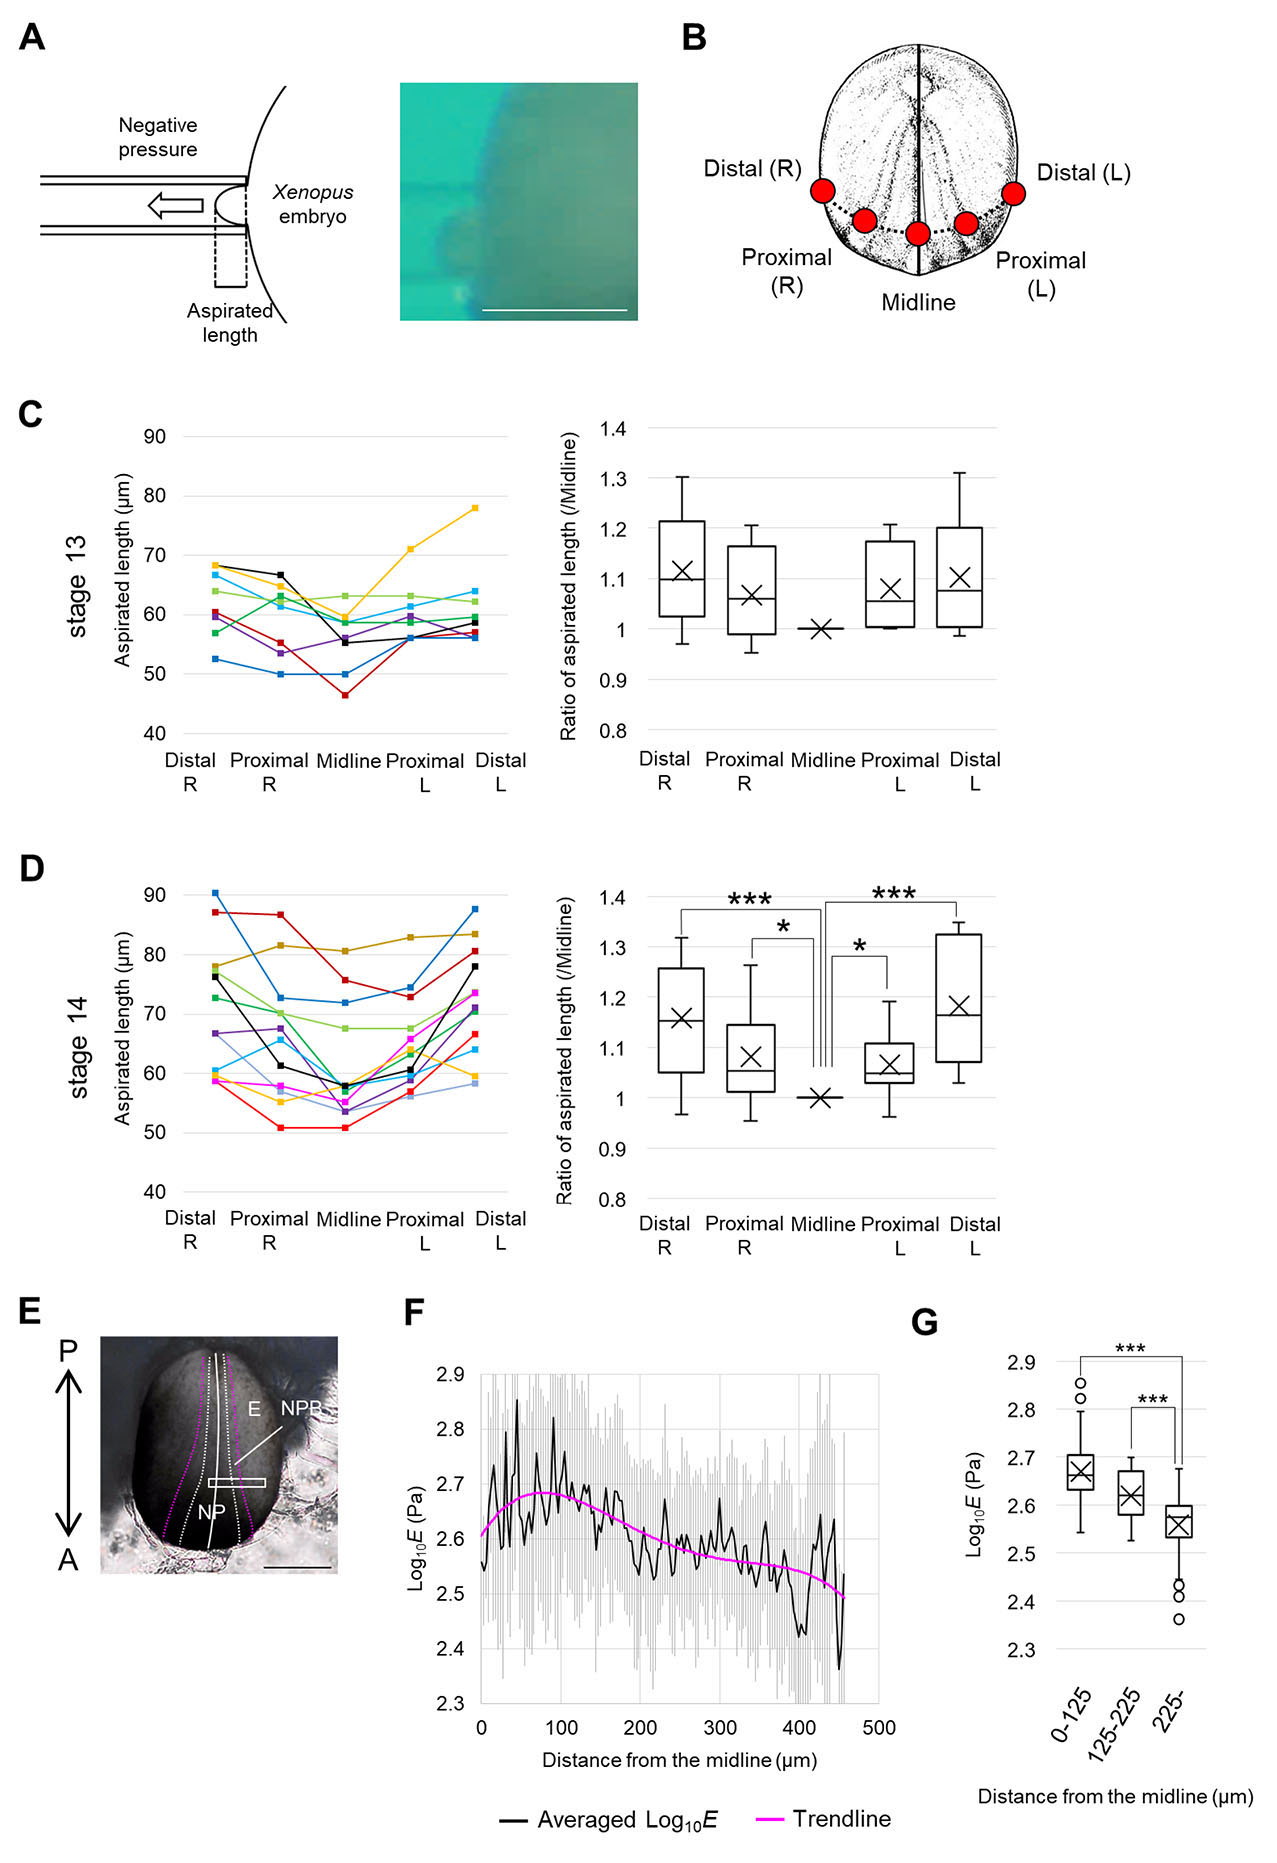
Fig. 1. Estimation of tension in Xenopus neurulae with an aspiration assay and AFM measurements.
(A) Schematic figure of an aspirated Xenopus embryo and the bright field image. Scale bar, 500 μm. (B) Black line indicates the midline of embryo, and black dashed line indicates the antero-posterior coordinate of aspirated positions. Red circles indicate aspirated positions: Midline, both sides of Proximal and Distal (see Materials and Methods for details). (C) Result of the aspiration assay at the early neurula stage (st. 13). Length of aspirated tissue is shown in the left graph. Each line indicates actual length of aspirated tissue in each measurement (n = 8). Length ratio normalized by each aspirated length of Midline was shown in the right graph (boxplot: The horizontal line indicates the median. Edges of boxes indicate the first and third quartiles. The cross indicates the mean, and whiskers indicate the minimum and maximum). Statistical significance was analyzed with paired t-test, adjusted by Holm method. * p < 0.05. (D) Result of the aspiration assay at the early neurula stage (st. 14). Length of aspirated tissue is shown in the left graph. Each line indicates the actual length of aspirated tissue in each measurement (n = 12). The length ratio normalized by each aspirated length of Midline is shown in the right graph (boxplot). Statistical significance was analyzed with a paired t-test, adjusted by Holm method. * p < 0.05. ** p < 0.01. (E) Bright field image of an embryo measured with AFM at the early neurula stage (st. 13). The white line indicates the midline of the embryo. The white dashed line indicates the boundary between NP and NPB. The magenta dashed line indicates the boundary between NPB and epidermis. A white box indicates the region measured with AFM. A, anterior side, P, posterior side, E, the epidermis. Scale bar, 500 μm. (F) Statistical analysis of AFM measurement. Young’s modulus (log10E) on each lateral coordinate (distance from the midline) was averaged (n = 4 embryos, each data is shown in Fig. S2). Gray lines indicate standard deviations. The magenta line indicates a trendline for a quartic polynomial. (G) Each value (averaged Log10E) in F was categorized into three regions according to the distance from the midline (0-125 μm, 126-225 μm, 226-459 μm), and shown in a boxplot. n = 42 data points (0-125 μm), 34 data points (126-225 μm), 77 data points (226-459 μm). Statistical significance was analyzed with Welch’s t-test, adjusted by Holm method. ** p < 0.01. *** p < 0.001.
To measure tension on the surface of ectoderm, we also measured Young’s modulus using atomic force microscopy (AFM) that enables high-resolution measurement of elasticity and topology of biological samples (Fujii and Okajima, 2019) (Fig. 1E, Fig. S1C) (see Materials and Methods for details). Apparent Young’s modulus of ectoderm was successfully measured, with one unit comprising a region 3 × 3 μm. To compare differences along the medio-lateral direction, average values of Young’s modulus (log10E) were graphed. Considering that the apparent elasticity is sensitive to cellular surface tension (Hirano et al., 2022), this result suggests that tension in ectodermal cells decreases laterally (Fig. 1 F-G, Fig. S2), consistent to the aspiration assay.
Mechanical force application enhances neural crest formation, but force reduction suppresses it
To roughly explore tissues whose formation is regulated by mechanical stimulation, we applied an enormous stimulation, centrifugation at 450 × g, to activate FGF signaling in Xenopus gastrulae (Kinoshita et al., 2020), for about 3 h (from st. 13-15) (Fig. 2A). Some embryos were deformed asymmetrically during centrifugation, suggesting that the direction of force on each embryo was different. Therefore, we collected only embryos whose NP faced upward. Centrifuged embryos were fixed at the mid-neurula stage (st. 15), and the spatial expression pattern of neural marker genes was visualized by whole-mount in situ hybridization. Foxd3 expression, an NC marker gene, appeared to be enhanced (Fig. 2B). On the other hand, expression of both Sox3 (NP marker) (Fig. 2B) and Paraxis (paraxial mesoderm marker, which involves NC specification) (Fig. S3 A-C) was not substantially changed. Expression levels of neuroectodermal marker genes were quantified by RT-qPCR, using embryos centrifuged with the same or reduced force (200 × g). Foxd3 expression increased in both conditions, and Slug expression, another NC marker gene, increased significantly only at 200 × g, and slightly at 450 × g (Fig. 2C). Expression levels of Sox2, an NP marker gene, and Krt12.4, an epidermal marker gene, were not significantly changed (Fig. 2C).
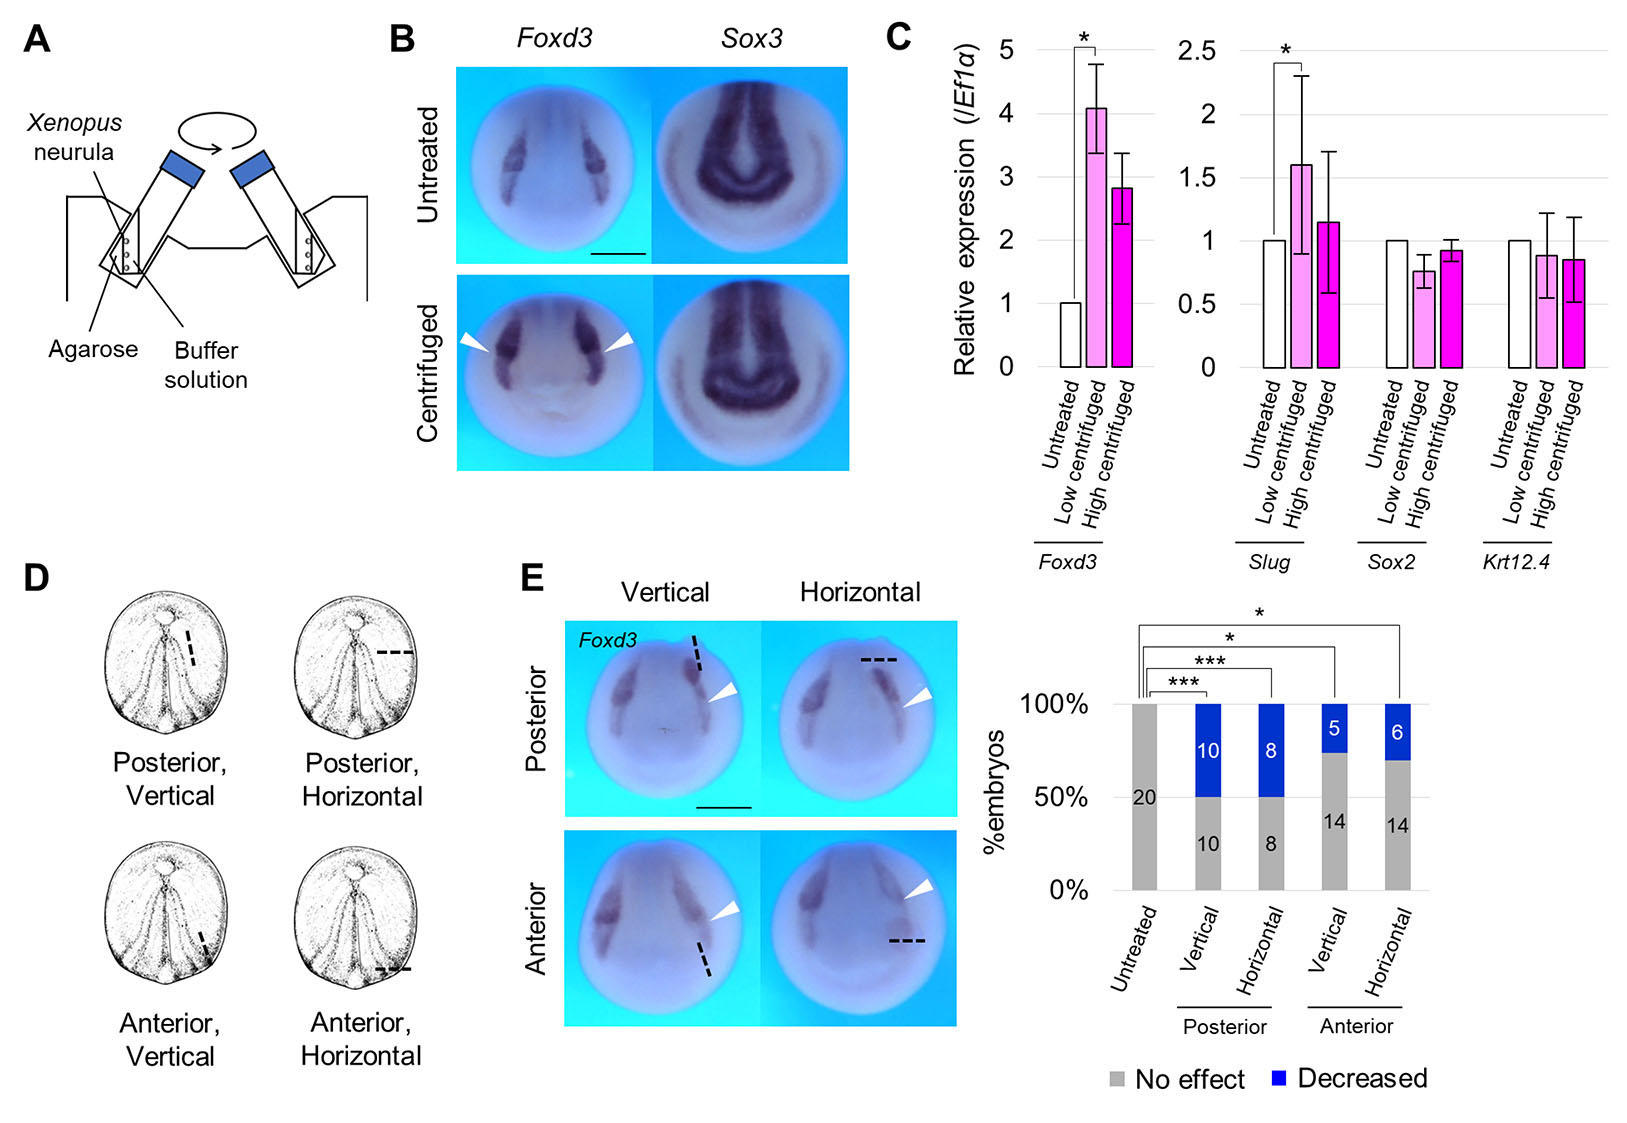
Fig. 2. Enhancement of neural crest formation by centrifugation, and suppression by cutting of neighboring tissue.
(A) Schematic figure showing centrifugation of embryos. Xenopus embryos were centrifuged with fixed angle rotor in an agarose-coated 50 mL tube from the early neurula stage (st. 13) to the mid-neurula stage (st. 15). How to collect embryos after centrifugation is described in Material and Methods. (B) Expression pattern of Foxd3 and Sox3 in centrifuged embryos at the mid-neurula stage (st. 15). White arrowheads indicate enhanced Foxd3-expression. Scale bar, 500 μm. (C) Expression level (RT-qPCR) of Foxd3, Slug, Sox2, Krt12.4 in centrifuged embryos (low centrifugation, 200 × g; high, 450 × g) at the mid-neurula stage (st. 15). Expression level of Ef1α was used as an internal control. Replicates of the experiment: 3 (Foxd3, Slug, Sox2, Krt12.4 (Low)), 6 (Foxd3, Slug (High)), 4 (Sox2 (High)), 3 (Krt12.4 (High)) (> 5 embryos were used for each replicate). Statistical significance was analyzed with Student t-test, adjusted by Holm method. * p < 0.05. (D) Schematic figure showing the cutting site of embryos. Ectoderm was cut to ~1/4 of the embryo diameter. Black dashed lines indicate the cutting site. (E) Expression pattern of Foxd3 in embryos with cut tissue at the mid-neurula stage (st. 15). A black dashed line indicates the cutting site. A white arrowhead indicates reduced expression. Scale bar, 500 μm. The ratio of phenotypes is summarized in stacked bar graphs. Numbers in the graph indicates numbers of embryos with each phenotype. Statistical significance was analyzed with Fisher’s exact test, adjusted by Holm method. * p < 0.05. *** p < 0.001.
Conversely, to reduce mechanical stimulation, we utilized an invasive method, tissue cutting, in which a portion of ectoderm was cut vertically or horizontally at st. 13 across mesoderm lining the ectoderm (Fig. 2D). We visualized the Foxd3-expressing region and revealed that it shrank in both cases (Fig. 2E). On the other hand, the expressing region did not change with a shallow cut of the same length that did not penetrate to mesoderm (Fig. S3D-E), possibly because the shallow cut heals quickly. These results suggest that mechanical stimulation induces NC formation in Xenopus embryos, but we could not determine whether this is the case with in vivo-magnitude stimulation.
Tension generated by cytoskeletal regulation enhances neural crest formation
To examine whether tension of in vivo magnitude enhances NC formation, we used Plekhg5, which encodes RhoGEF protein and induces apical constriction with myosin activation, organizing gastrulation at Xenopus gastrula stage (Popov et al., 2018). We injected mRNA of Plekhg5 into a ventral blastomere at the 4-8-cell stage, slightly lateral to the animal pole (Fig. 3A), corresponding to epidermis slightly lateral to the NC at the neurula stage (Fig. S4A). Ectopic accumulation of pigment (Fig. S4B) and F-actin (Fig. S4C), which is an indicator of the apical constriction, was observed in the Plekhg5-expressed side. We examined mechanical properties of Plekhg5-expressing tissue during the neurula stage with aspiration assay. Aspirated length was smaller on the Plekhg5-expressing side compared to the uninjected side (Fig. S4 D-F), suggesting that Plekhg5 enhanced tension at the neurula stage, and this change occurs locally, seemingly limited to one side of the embryos (Fig. S4F).
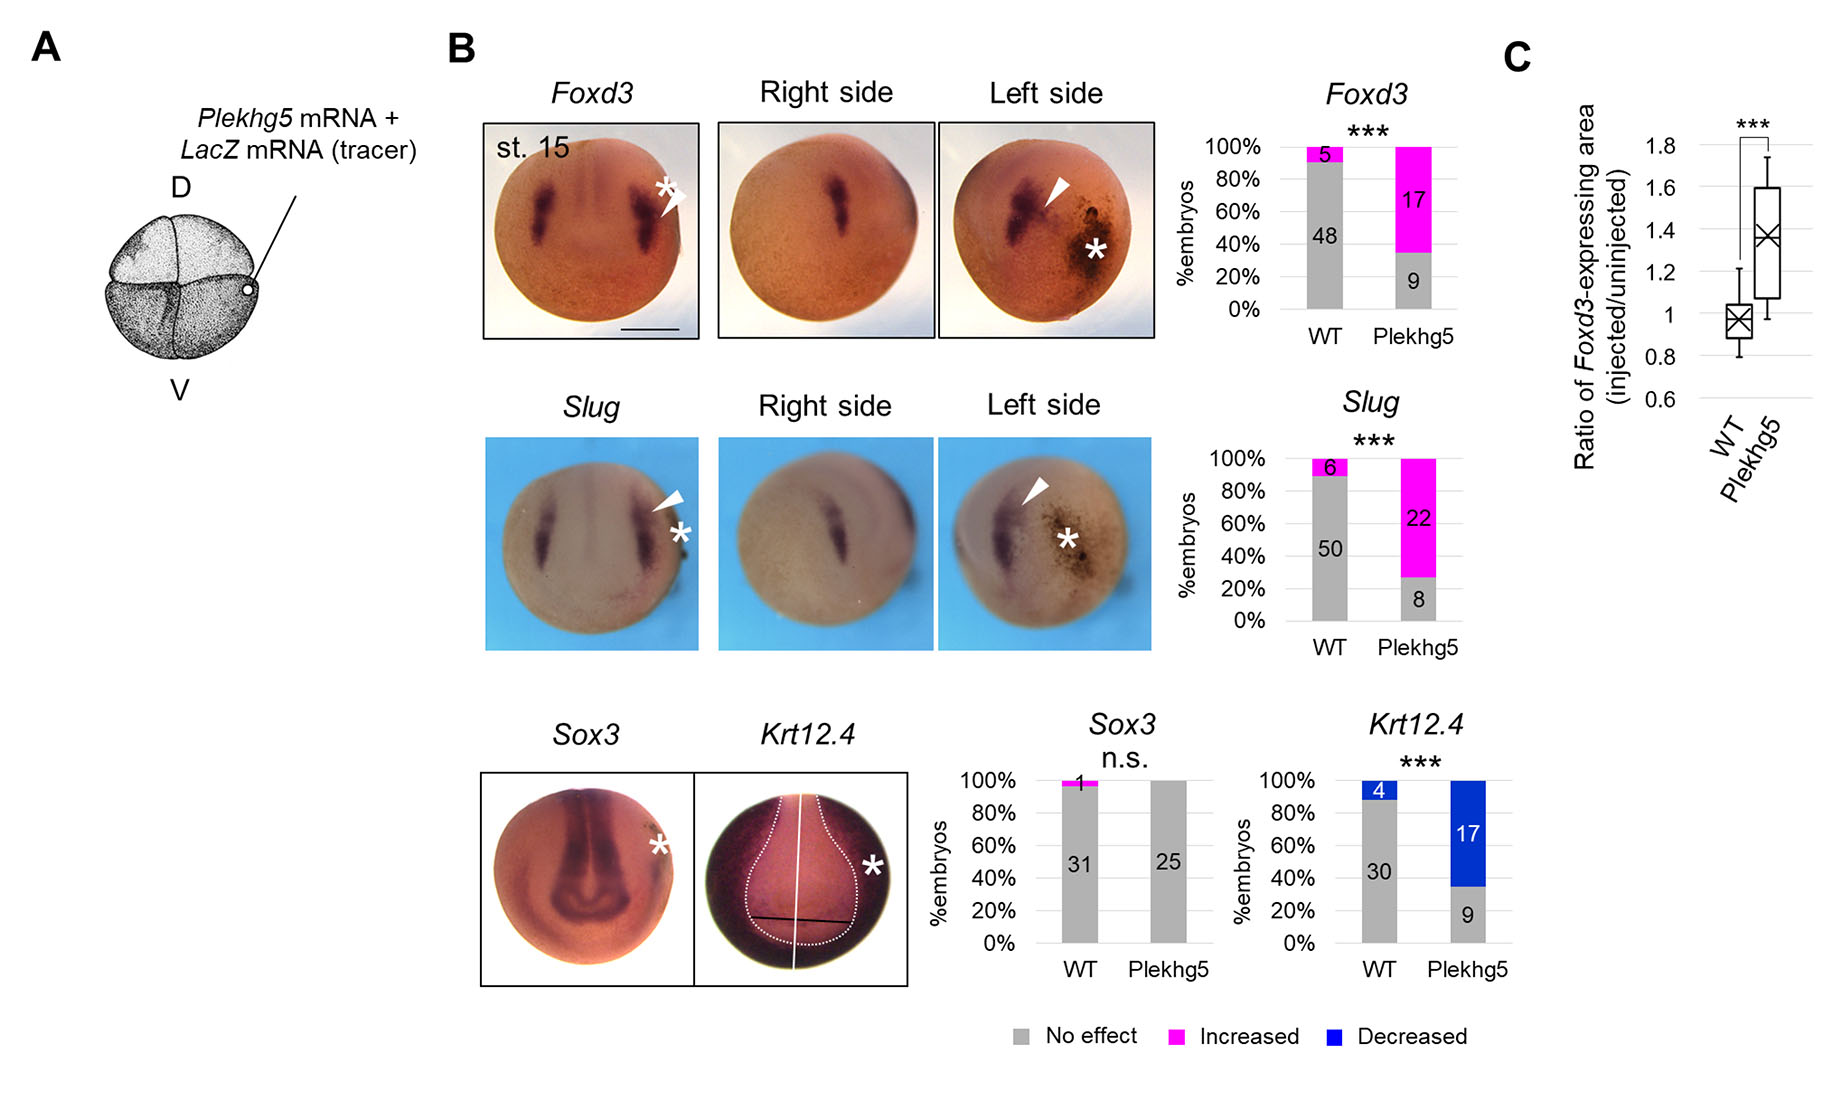
Fig. 3. Enhancement of neural crest formation by cell contraction at biological magnitude.
(A) Schematic figure of Plekhg5 mRNA microinjection. D, dorsal blastomere, V, ventral blastomere. 200 pg Plekhg5 mRNA and LacZ mRNA (tracer) were injected into a ventral blastomere at the 4-8-cell stage. (B) Expression pattern of Foxd3 and Slug, Sox3, and Krt12.4 in Plekhg5-expressing embryos at the mid-neurula stage (st. 15). Asterisks indicate ectopic cell contraction induced by Plekhg5. White arrowheads indicate expanded regions of Slug or Foxd3 expression. A white line indicates the midline of the embryo, and a white dashed line indicates the boundary of the Krt12.4-expressing region. A black line indicates the distance from the midline, showing a reduced Krt12.4-expressing region on the injected side. Scale bar, 500 μm. The ratio of phenotypes is summarized in stacked bar graphs. Numbers in the graph indicate numbers of embryos with each phenotype. Statistical significance was analyzed with Fisher’s exact test. *** p < 0.001. (C) Quantification of the area of the Foxd3-expressing region in Plekhg5-expressing embryos at the mid-neurula stage (st. 15) is shown in a boxplot (The horizontal line indicates the median. Edges of boxes indicate the first and third quartiles. The cross indicates the mean, and whiskers indicate the minimum and maximum). Measured samples are shown in Fig. S4F. n = 15 each. Statistical significance was analyzed with Student t-test. *** p < 0.001.
Then, we visualized the spatial expression pattern of NC marker genes, FoxD3 and Slug, in Plekhg5-expressing embryos (Fig. 3B, Fig. S4G). The expressing region of both NC marker genes expanded laterally toward ectopic contraction (Fig. 3B, Fig. S4G), similar to that of an NPB marker gene, Pax3, which induces Foxd3 and Slug expression (Fig. S4H). Consistently, the Krt12.4-expressing region shrank on the Plekhg5-expressing side, and the Sox3-expressing region was not substantially changed (Fig. 3B). Plekhg5 expression did not significantly affect the Paraxis-expressing region (Fig. S4I), suggesting that enhancement of NC gene expression by Plekhg5 was not due to ectopic induction by paraxial mesoderm. In addition, we examined this differentiation with a protein level. As a result, the number of PAX3-positive cells significantly increased on the Plekhg5-expressing side (Fig. S4J). These results suggest that ectopic contraction induced by Plekhg5 enhanced NC formation and suppressed epidermis formation.
Non-invasive tension relaxing suppresses neural crest formation
In the tissue cutting experiment described above (Fig. 2 D,E), it was possible that cutting tissue including mesoderm might have physically inhibited diffusion/reception of morphogens, such as FGF and Wnt. To confirm the requirement of tension for neuroectodermal patterning using a non-invasive approach, we injected a myosin inhibitor, Blebbistatin (BB), into a dorsal blastomere at the 4-8-cell stage, lateral to the animal pole (Fig. 4A). To determine the appropriate concentration of BB, we used gastrulation defects as an indicator. Various concentrations of BB were injected, and gastrulation defects, which require myosin, were observed in about 80% of embryos injected with 5 nL of a 200 μM BB solution, and about 50% with 100 μM (Fig. S5 A-C). Injections of 100 μM BB decreased aspirated length in aspiration assay (Fig. S5D), and did not substantially inhibit cell division (Fig. S5 E-G). Therefore, we performed the following experiments with BB at < 100 μM and only observed embryos with completed gastrulation.
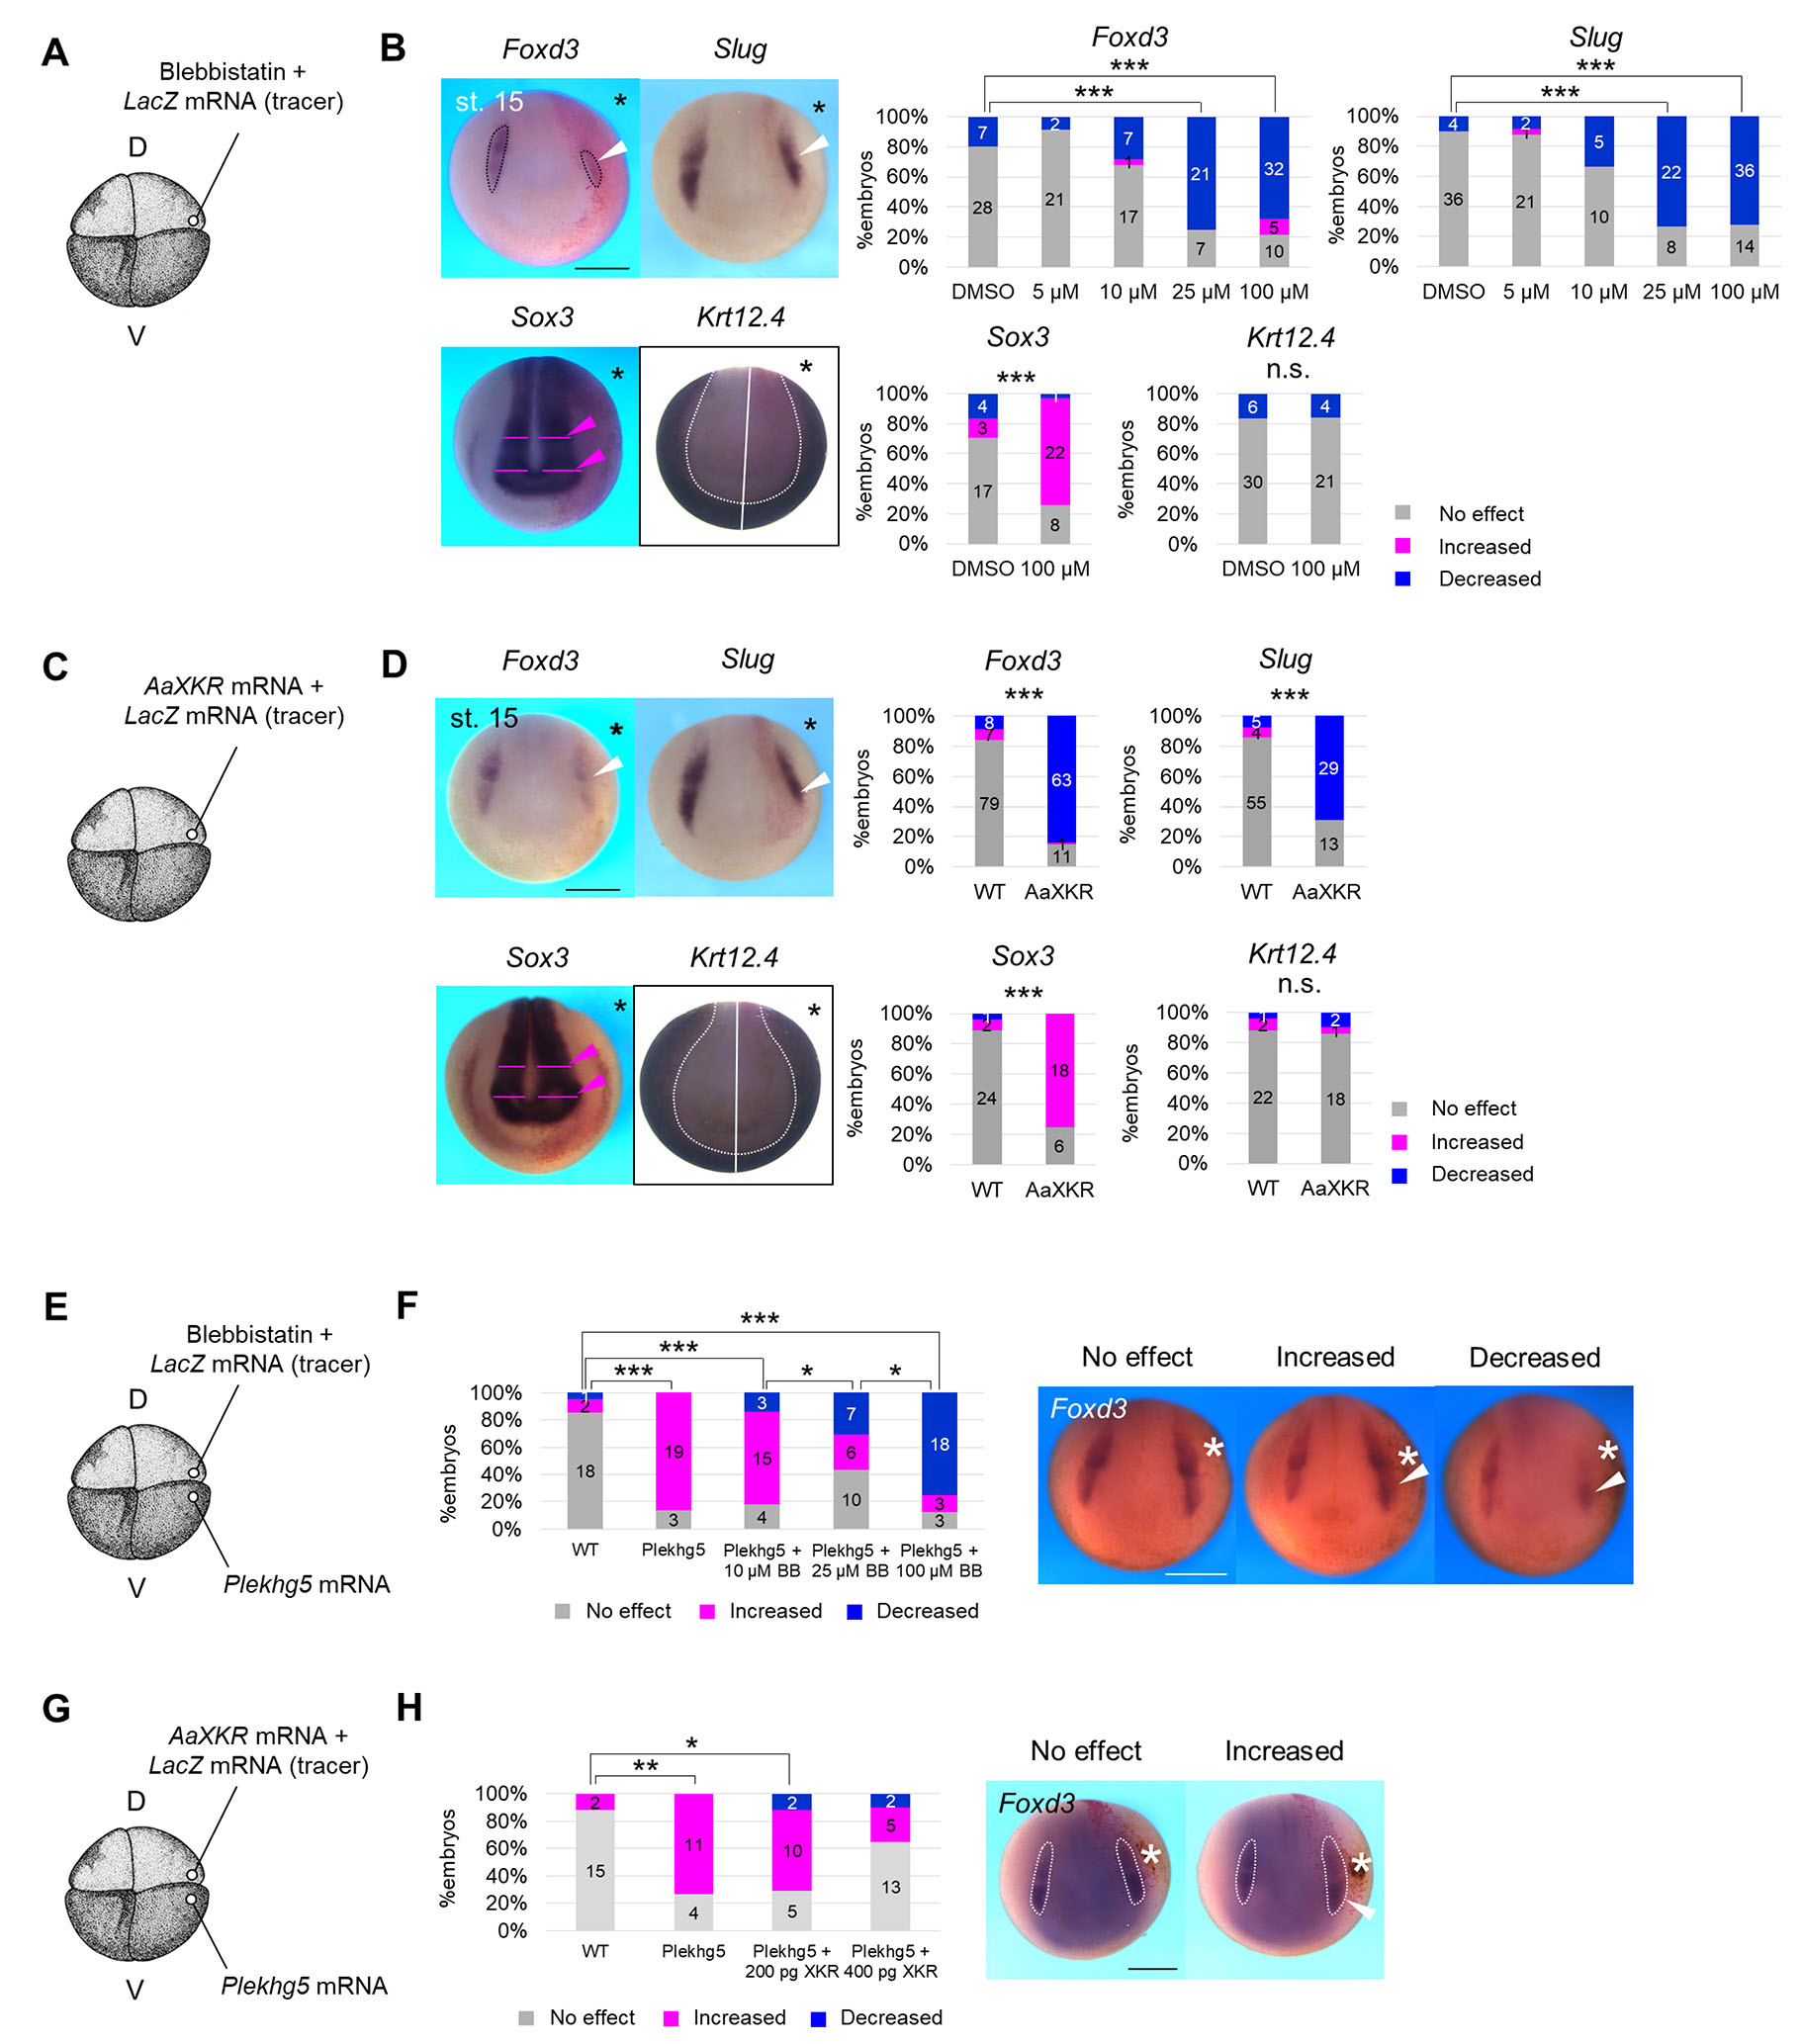
Fig. 4. Suppression of neural crest formation with non-invasive tension relaxation.
(A) Schematic figure of Blebbistatin microinjection. D, dorsal blastomere, V, ventral blastomere. A 5 nL of Blebbistatin solution (0 (DMSO), 5, 10, 25, 100 μM) with LacZ mRNA (tracer) was injected into a dorsal blastomere at the 4-8-cell stage. (B) Expression pattern of Foxd3, Slug, Sox3, and Krt12.4 in Blebbistatin-injected embryos at the mid-neurula stage (st. 15). Asterisks indicate the injected side. Black dashed lines indicate the expressing region of Slug and Foxd3, and white arrowheads indicate shrunken regions of expression. A magenta arrowhead indicates expanded expression of Sox3, and magenta lines indicate the width of the Sox3-expressing region. A white line indicates the midline of embryos, and a white dashed line indicates the boundary of Krt12.4-expressing region. Scale bar, 500 μm. Ratios of phenotypes are summarized in stacked bar graphs. Numbers in the graph indicates numbers of embryos with each phenotype. Statistical significance was analyzed with Fisher’s exact test, adjusted by Holm method. *** p < 0.001. (C) Schematic figure of AaXKR mRNA microinjection. D, dorsal blastomere, V, ventral blastomere. A solution of 400 pg AaXKR mRNA with LacZ mRNA (tracer) was injected at the 4-8-cell stage. (D) Expression pattern of Slug, Foxd3, Sox3 and Krt12.4 in AaXKR-expressing embryos at the mid-neurula stage (st. 15). Asterisks indicate the injected side. White arrowheads indicate shrunken regions of expression of Slug and Foxd3. Magenta arrowheads indicate expanded expression of Sox3, and magenta lines indicate the width of the Sox3-expressing region. A white line indicates the midline of embryos, and a white dashed line indicates the boundary of Krt12.4-expressing region. Scale bar, 500 μm. Ratios of phenotypes are summarized in stacked bar graphs. Numbers in the graph indicate numbers of embryos with each phenotype. Statistical significance was analyzed with Fisher’s exact test. *** p < 0.001. (E) Schematic figure of microinjection of both Plekhg5 mRNA and Blebbistatin. D, dorsal blastomere, V, ventral blastomere. 200 pg Plekhg5 mRNA was injected into a dorsal blastomere, and a 5-nL solution of Blebbistatin (0 (DMSO), 5, 10, 25, 100 μM) with LacZ mRNA (tracer) was injected into a ventral blastomere at the 4-8-cell stage, as indicated in the figure. (F) Expression pattern of Foxd3 in embryos injected with both Plekhg5 mRNA and Blebbistatin at the mid-neurula stage (st. 15). An asterisk indicates ectopic cell contraction caused by Plekhg5. Scale bar, 500 μm. Ratios of phenotypes are summarized in stacked bar graphs. Numbers in the graph indicate numbers of embryos with each phenotype. Statistical significance was analyzed with Fisher’s exact test, adjusted by Holm method * p < 0.05. *** p < 0.001. (G) Schematic figure of microinjection of both Plekhg5 and AaXKR mRNA. D, dorsal blastomere, V, ventral blastomere. 200 pg Plekhg5 mRNA was injected into a dorsal blastomere, and 200 or 400 pg AaXKR mRNA with LacZ mRNA (tracer) was injected into a ventral blastomere at the 4-8-cell stage, as indicated in the figure. (H) Expression pattern of Foxd3 in embryos injected with both Plekhg5 and AaXKR mRNA at the mid-neurula stage (st. 15). An asterisk indicates ectopic cell contraction caused by Plekhg5. Scale bar, 500 μm. Ratios of phenotypes are summarized in stacked bar graphs. Numbers in the graph indicate numbers of embryos with each phenotype. Statistical significance was analyzed with Fisher’s exact test, adjusted by Holm method. * p < 0.05. ** p < 0.01.
In BB-injected embryos, the expressing region of Foxd3 and Slug shrank in a concentration-dependent manner (Fig. 4B). Consistently, the number of PAX3-positive cells was reduced on the BB-injected side (Fig. S5H). The Sox3-expressing region expanded laterally, and the Krt12.4- and Paraxis-expressing region was not clearly changed (Fig. 4B and S5I). We also performed RT-qPCR, and found that Slug expression was slightly reduced by BB, but Foxd3 expression was increased (Fig. S5J). Expression levels of Sox2 and Krt12.4 were not significantly changed. Since the expression level of Sox2 did not change, but the Sox3-expressing region expanded, it appears that myosin inhibition disturbed tissue folding, and NP expanded in appearance. In addition, a clear change in the tissue organization, which can affect physiological force, was not observed in the hemi-section of BB-injected embryos (Fig. S5K).
In the above experiments, we injected BB to compare the injected and uninjected sides. However, it is possible that BB caused substantial defects in early embryogenesis, other than relaxing tension during NC induction. Therefore, to perform BB treatment within a limited time window, we incubated embryos in medium containing various concentrations of BB from st. 11 (mid-gastrula stage), which decreases elasticity of Xenopus ectoderm (Hirano et al., 2022), and found that expression levels of both Foxd3 and Slug decreased with high concentrations of BB (Fig. S5L).
Regarding BB treatment, there is another possibility that the cytoskeletal protein, myosin, regulates NC formation directly, rather than via mechanical stimulation. To examine this, we used phospholipid scramblase, an insect-derived XKR (XK-related protein), which relaxes tension in a cytoskeleton-independent manner. Although mammalian XKR is activated during apoptosis to expose phosphatidylserine on cell surfaces (Sakuragi et al., 2019; Suzuki et al., 2014), insect XKR is constitutively active in living cells and relaxes membrane tension by disrupting phospholipid asymmetry. XKR derived from Aedes albopictus (AaXKR) relaxes tension also in mammalian cells without other substantial defects, including apoptosis (Shiomi et al., 2021). Therefore, we injected two amounts of AaXKR mRNA into 4-8-cell-stage embryos, lateral to the animal pole (Fig. 4C, Fig. S6A) to determine an appropriate amount of the mRNA. Injection with 1 ng mRNA caused enlargement of cell size (Fig. S6B); however, while 400 pg mRNA did not significantly affect cell size (Fig. S6C), it significantly relaxed the tension (Fig. S6D). Because excessive cell extension by AaXKR injection possibly complicates analysis of spatial gene expression, we performed the following experiments with 400 pg AaXKR mRNA.
AaXKR overexpression reduced the expressing region of both Foxd3 and Slug at st. 15 (Fig. 4D), consistent with the BB treatment. In addition, expression levels of Foxd3 and Slug were reduced (Fig. S6E). The NP region (Sox3-expressing region) expanded laterally (Fig. 4D), but this may be just a change in appearance, since the Sox2 expression level was not significantly changed (Fig. S6C). Krt12.4 expression was not significantly changed by either in situ hybridization (Fig. 4D) or RT-qPCR (Fig. S6E). The Paraxis-expressing region did not substantially change on the AaXKR-expressed side (Fig. S6F). The tissue organization did not clearly change in the appearance of hemisection by AaXKR expression (Fig. S6G). These results suggest that mechanical force is required for NC formation.
To further confirm the requirement of tension for NC formation, we performed a rescue experiment with Plekhg5 and two methods of relaxing tension, BB and AaXKR: i.e., if Plekhg5 enhanced NC gene expression through tension enhancement, the phenotype should be rescued by relaxing tension. We injected Plekhg5 mRNA with various concentrations of BB (Fig. 4E) or AaXKR mRNA (Fig. 4G), and found that both BB and AaXKR rescued Plekhg5-induced expansion of the Foxd3-expressing region in a concentration-dependent manner (Fig. 4 F,H).
Mechanical force is involved also in the onset of neural crest formation
In the above experiments, we mainly focused on later stages of neuroectodermal patterning (around stage 15). However, NC gene expression begins at an earlier stage (around st. 12) (Aybar et al., 2003; Mayor et al., 1995; Sasai et al., 2001). To examine whether mechanical force is involved in the onset of NC gene expression, we observed the spatial expression pattern of NC genes at st. 12. Consistent with the later-stage experiments, in Plekhg5-expressing embryos, the Foxd3-, Slug- and Pax3-expressing region expanded toward ectopic cell contraction, while the Sox3- and Paraxis-expressing region was not changed (Fig. 5 A-B, Fig. S4G-H), In AaXKR-expressing embryos, the Foxd3-expressing region was reduced, while the Sox3-expressing region was not changed (Fig. 5 C-D). These results suggest that mechanical force is also involved in the onset of NC formation.
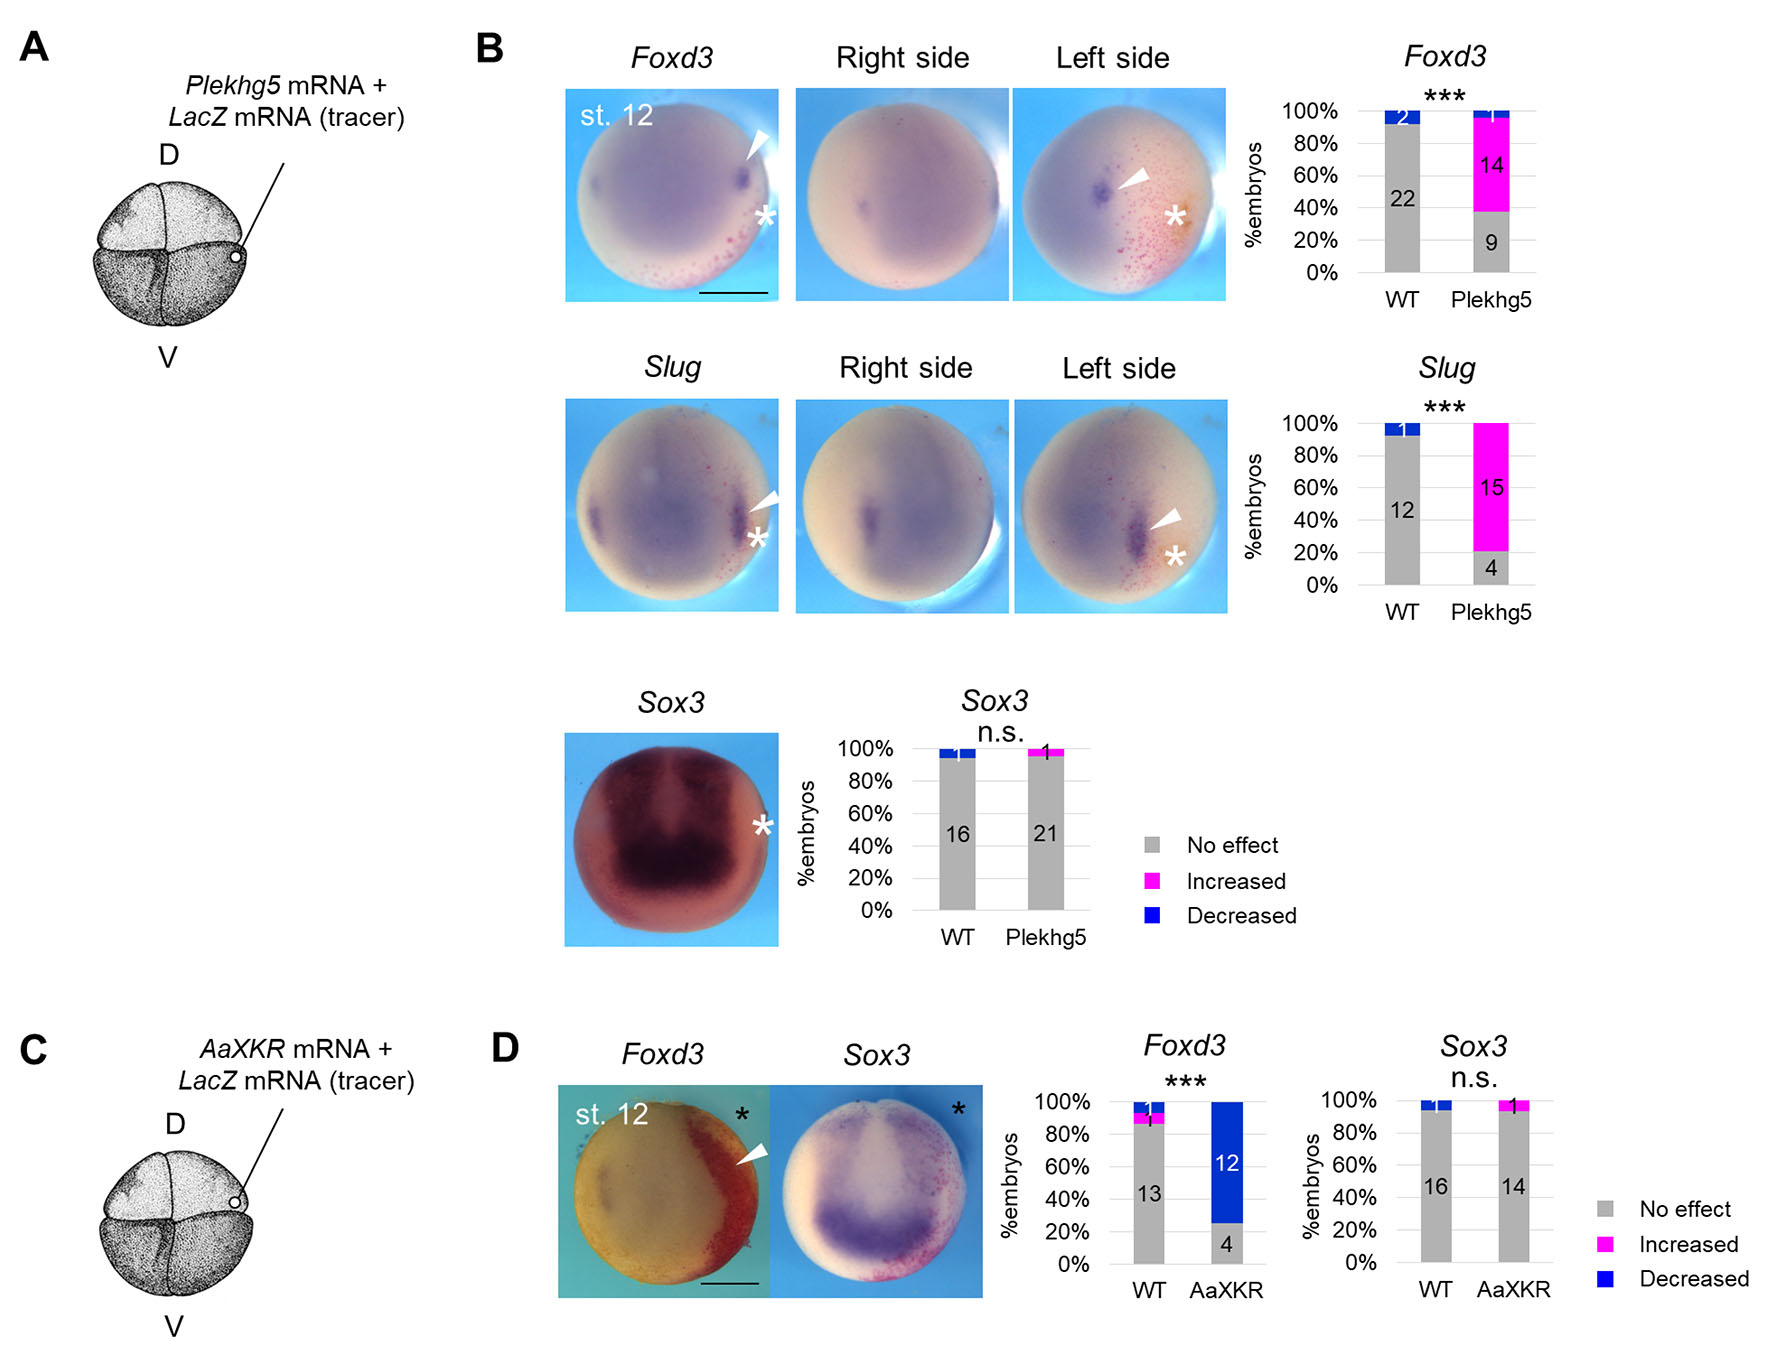
Fig. 5. Enhancement of neural crest formation by mechanical force at the onset of neural crest formation.
(A) Schematic figure of Plekhg5 mRNA microinjection. D, dorsal blastomere, V, ventral blastomere. 200 pg Plekhg5 mRNA and LacZ mRNA (tracer) were injected into a ventral blastomere at the 4-8-cell stage. (B) Expression pattern of Foxd3 and Slug, Sox3 in Plekhg5-expressing embryos at the late gastrula stage (st. 12). Asterisks indicate ectopic cell contraction induced by Plekhg5. White arrowheads indicate expanded regions of Slug or Foxd3 expression. Scale bar, 500 μm. The ratio of phenotypes is summarized in stacked bar graphs. Numbers in the graph indicate numbers of embryos with each phenotype. Statistical significance was analyzed with Fisher’s exact test. *** p < 0.001. (C) Schematic figure of AaXKR mRNA microinjection. D, dorsal blastomere, V, ventral blastomere. A solution of 400 pg AaXKR mRNA with LacZ mRNA (tracer) was injected at the 4- or 8-cell stage. (D) Expression pattern of Foxd3, Sox3 in AaXKR-expressing embryos at the late gastrula stage (st. 12). Asterisks indicate the injected side. White arrowheads indicate the shrunken region of expression of Foxd3. Scale bar, 500 μm. Ratios of phenotypes are summarized in stacked bar graphs. Numbers in the graph indicate numbers of embryos with each phenotype. Statistical significance was analyzed with Fisher’s exact test. *** p < 0.001.
Tension activates FGF and Wnt signaling in Xenopus neurulae
To reveal how mechanical stimulation regulates NC formation, we focused on FGF and Wnt signaling, both of which are required for NC formation. Phosphorylation of Erk (pErk), an indicator of FGF-signal activation, was increased by centrifugation at st.13-15 (Fig. 6A) and Plekhg5 expression (Fig. 6 B-C). To examine whether relaxing tension inhibits FGF signaling, we injected either BB or AaXKR mRNA into 4-8-cell-stage embryos (Fig. 6D). As a result, pErk decreased in both BB-injected embryos (Fig. 6E) and AaXKR-expressing embryos (Fig. 6F). Adding BB into medium at st. 11-14 also decreased pErk in a concentration-dependent manner (Fig. 6G). These results suggest that FGF signaling is activated in a tension-dependent manner in Xenopus neurulae.
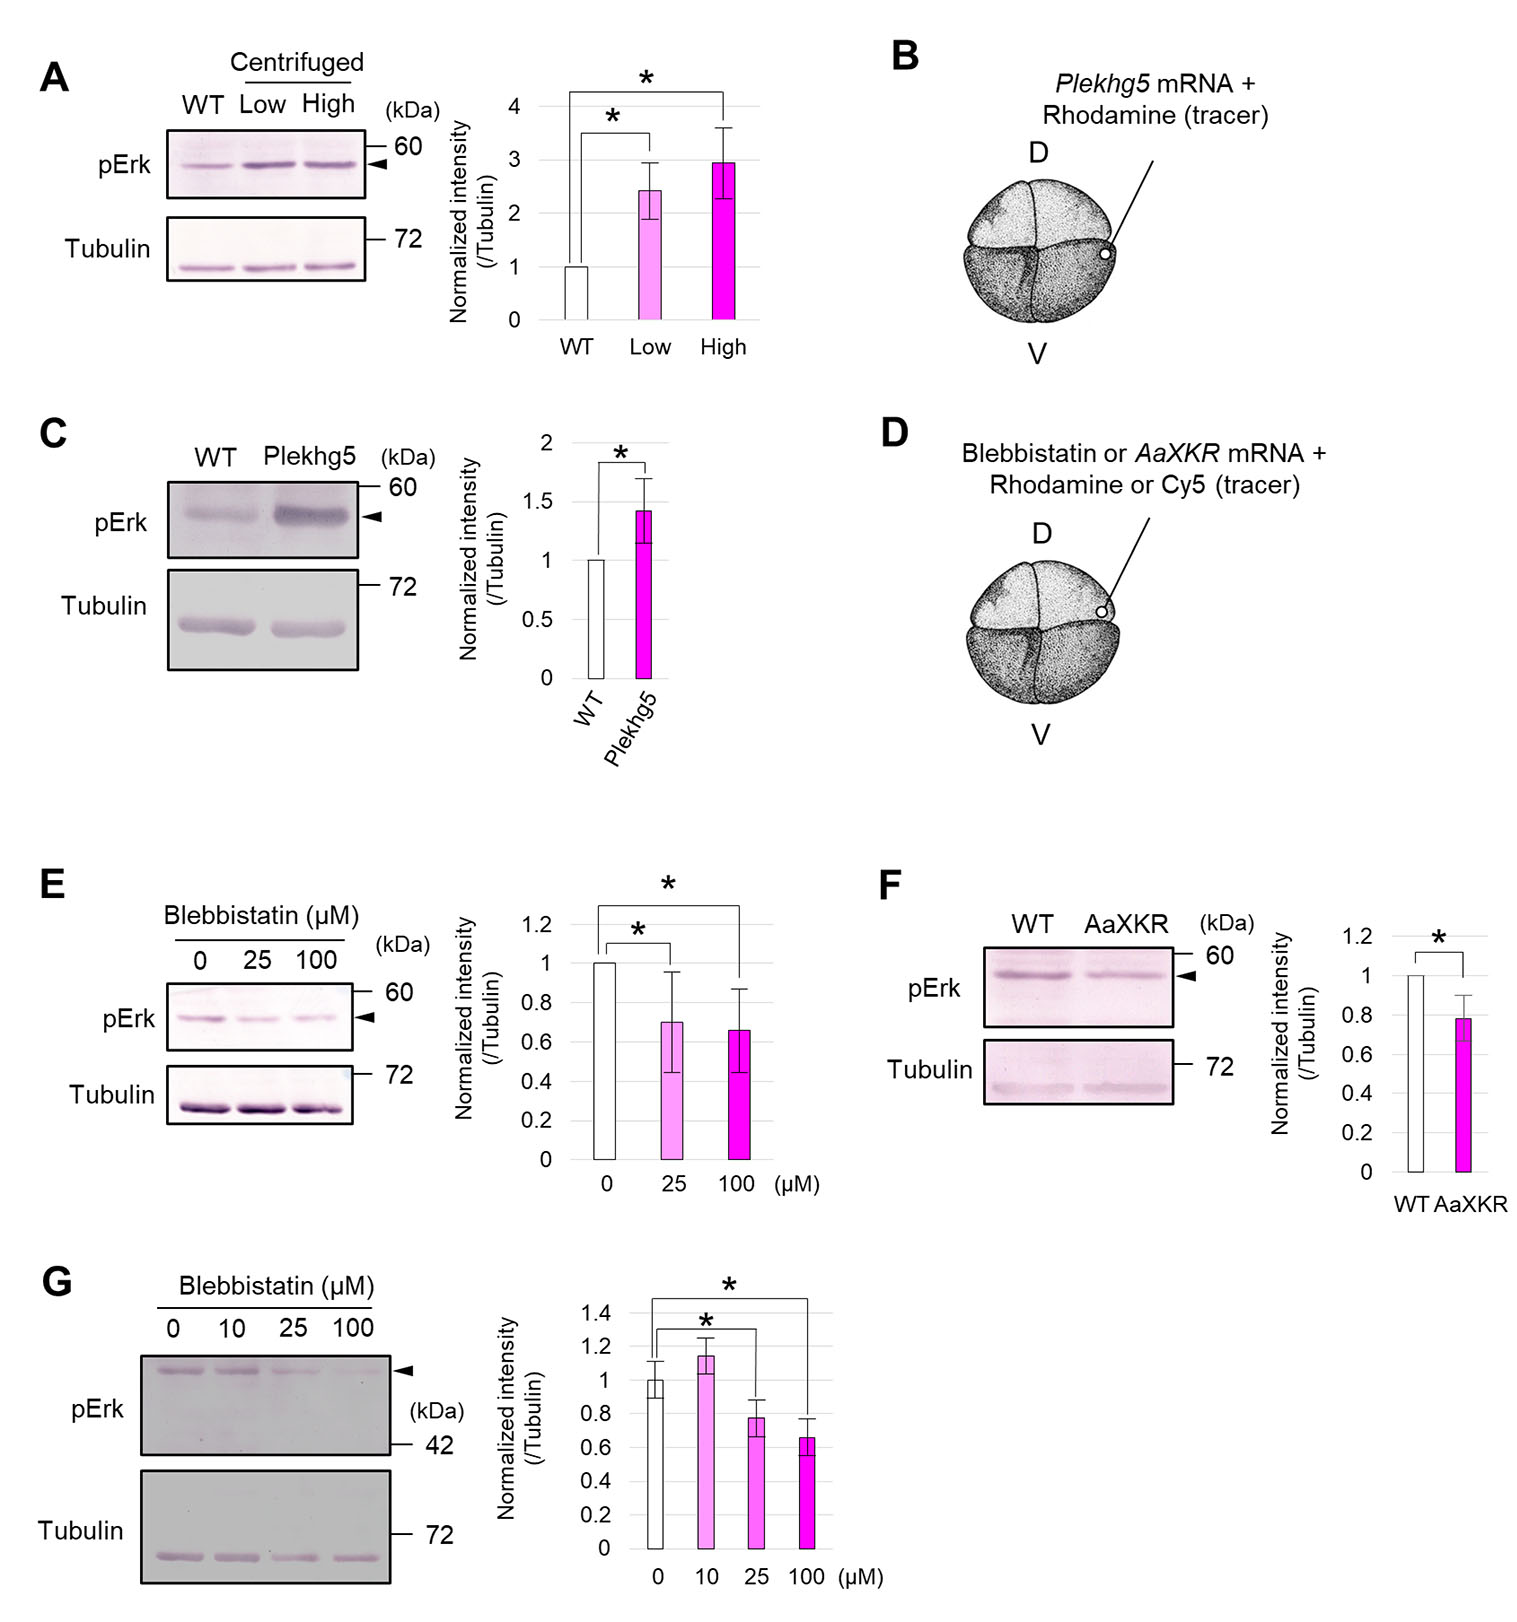
Fig. 6. Activation of FGF signaling by mechanical force, and inhibition by force relaxation.
(A) Western blot analysis of phosphorylated Erk (pErk) in centrifuged embryos (low centrifugation, 200 × g; high, 450 × g) at the mid-neurula stage (st. 15). Tubulin was used as an internal control. An arrowhead indicates pErk. Intensity ratio (normalized intensity, normalized against the Tubulin signal) is shown in bar graphs. Replicates of the experiment: 3 (> 5 embryos were used for each replicate). Statistical significance was analyzed with paired t-test, adjusted by Holm method. * p < 0.05. (B) Schematic figure of Blebbistatin or AaXKR mRNA microinjection. D, dorsal blastomere, V, ventral blastomere. A 5 nL solution of Blebbistatin (0 (DMSO), 25, 100 μM) or 400 pg AaXKR mRNA, with Rhodamine-dextran or Cy5 (tracer), was injected into a dorsal blastomere at the 4-8-cell stage. (C) Western blot analysis of pErk in Blebbistatin-injected embryos at the mid-neurula stage (st. 15). Tubulin was used as an internal control. An arrowhead indicates pErk. Intensity ratio normalized against the Tubulin signal (normalized intensity) is shown in bar graphs. Replicates of the experiment: 7 (> 5 embryos were used for each replicate). Statistical significance was analyzed with paired t-test, adjusted by Holm method. * p < 0.05. (D) Western blot analysis of pErk in AaXKR-expressing embryos at the mid-neurula stage (st. 15). Tubulin was used as an internal control. An arrowhead indicates pErk. The intensity ratio normalized against the Tubulin signal (normalized intensity) is shown as bar graphs. Replicates of the experiment: 5 (> 5 embryos were used for each replicate). Statistical significance was analyzed with a paired t-test. * p < 0.05. (E) Western blot analysis of pErk in embryos incubated in medium containing Blebbistatin at the mid-neurula stage (st. 15). Tubulin was used as an internal control. An arrowhead indicates pErk. Intensity ratio normalized against the Tubulin signal (normalized intensity) is shown in bar graphs. Replicates of the experiment: 3 (> 5 embryos were used for each replicate). Statistical significance was analyzed with paired t-test, adjusted by Holm method. * p < 0.05.
To examine Wnt signaling, we used nuclear localization of β-catenin as an indicator of Wnt-signal activation. Fluorescent intensity of nuclear β-catenin decreased on both the BB-injected side (Fig. 7 A-D) and the AaXKR-expressing side (Fig. 7A, E-G). These results suggest that relaxing tension inhibits Wnt signaling in Xenopus neurulae. Consistently, a target gene of Wnt signaling, Axin2 expression, decreased in both BB-injected embryos (Fig. S7A) and AaXKR-expressing embryos (Fig. S7B). In addition, Axin2 expression increased in centrifuged embryos (Fig. S7C) and Plekhg5-expressing embryos (Fig. S7D). These results suggest that mechanical stimulation enhances β-catenin nuclear translocation, and activates Wnt signaling in Xenopus neurulae.
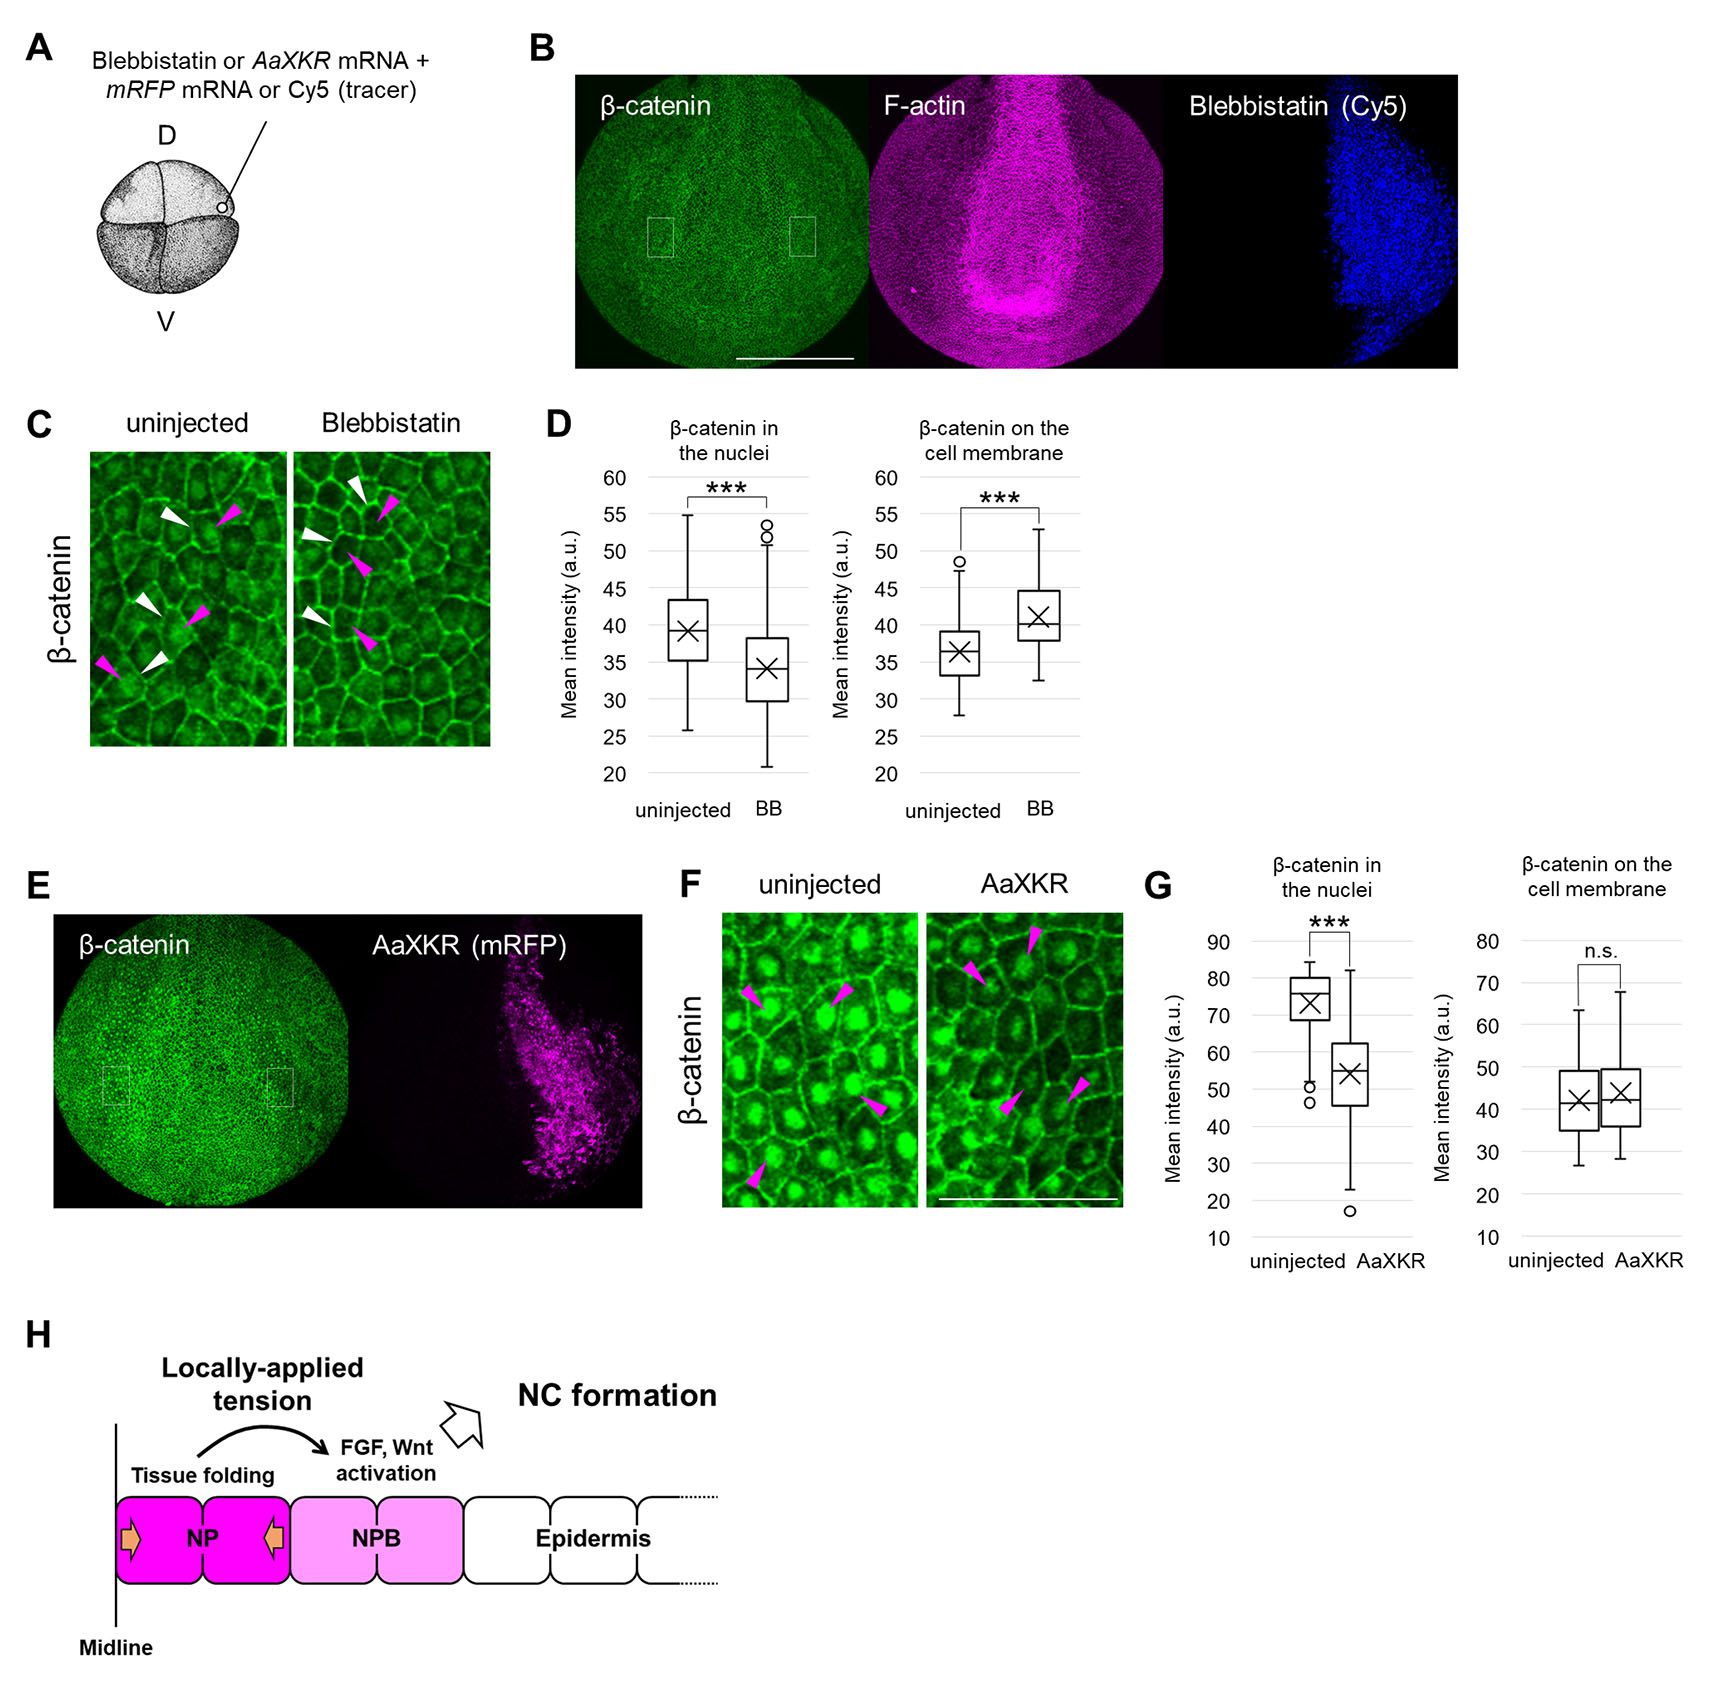
Fig. 7. Activation of Wnt signaling by mechanical force, and inhibition by force relaxation.
(A) Schematic figure of Blebbistatin or AaXKR mRNA microinjection. D, dorsal blastomere, V, ventral blastomere. A 5 nL solution of Blebbistatin (0 (DMSO), 25, 100 μM) or 400 pg AaXKR mRNA, with Rhodamine-dextran or Cy5 (tracer), was injected into a dorsal blastomere at the 4- or 8-cell stage. (B) Immunohistochemistry of β-catenin in 100 μM Blebbistatin-injected embryos at the mid-neurula stage (st. 15). Blebbistatin with the tracer Cy5 was injected into a dorsal blastomere as in (B). Green, β-catenin, Magenta, F-actin, Blue, Blebbistatin (Cy5). White dashed boxes indicate enlarged regions in (F). Scale bar, 500 μm. (C) Enlarged image of (B). Magenta arrowheads indicate β-catenin in nuclei, and white arrowheads show it on the cell membrane. Scale bar, 100 μm. (D) Quantitative analysis of β-catenin intensity in the nucleus and on the cell membrane in Blebbistatin-injected embryos at the mid-neurula stage (st. 15) is shown in a boxplot (The horizontal line indicates the median. Edges of boxes indicate the first and third quartiles. The cross indicates the mean, and whiskers indicate the minimum and maximum). Replicates of the experiment: 6 (nuclei: total 195 cells, membrane: total 100 cells). Statistical significance was analyzed with Student t-test. *** p < 0.001. (E) Immunohistochemistry of β-catenin in AaXKR-expressing embryos at the mid-neurula stage (st. 15). AaXKR mRNA with the tracer mem-RFP was injected into a dorsal blastomere as in (A). Green, β-catenin, Magenta, AaXKR (mem-RFP). White dashed boxes indicate enlarged regions in (F). Scale bar, 500 μm. (F) Enlarged image of (E). Magenta arrowheads indicate β-catenin in nuclei. Scale bar, 100 μm. (G) Quantitative analysis of β-catenin intensity in the nucleus and on the cell membrane in AaXKR-expressing embryos at the mid-neurula stage (st. 15) is shown in a boxplot (The horizontal line indicates the median. Edges of boxes indicate the first and third quartiles. The cross indicates the mean, and whiskers indicate the minimum and maximum). Replicates of the experiment: 5 (nuclei: total 228 cells, membrane: total 96 cells). Statistical significance was analyzed with Student t-test. *** p < 0.001. (H) Model of enhancement of NC formation by physiological tension. Tension was generated by NP folding and applied to NPB, and both FGF and Wnt signals are locally activated, resulting in NC formation in a narrow region.
Discussion
In this study, we revealed that mechanical stimulation is necessary for Xenopus neuroectodermal patterning (Fig. 7H). Ectopic mechanical stimulation of biological magnitude enhanced expression of NC genes (Fig. 3 B-C), while relaxed tension suppressed it (Fig. 4 A-E). In addition, epidermis shrank corresponding to expansion of NC with force application (Fig. 3B). These suggest that ectopically increased tension enhances NC formation and suppresses epidermal formation. However, dependence of NP formation on mechanical stimulation is controversial. In BB-injected and AaXKR-expressing embryos, the expressing region of an NP marker gene, Sox3, was seemingly expanded (Fig. 4 B,D). However, the expression level of another NP marker gene, Sox2, was not substantially changed with RT-qPCR (Fig. S5J, S6E). In addition, AaXKR did not affect the Sox3-expression region at st. 12, when neural tube closure is not initiated. These data suggest that expansion of NP at st. 15 was an artifact, possibly caused by disruption of neural tube closure. Krt12.4 expression was not changed on AaXKR-expressed or BB-injected sides (Fig. 4 B,D), suggesting that relaxing tension does not affect epidermal formation, while Plekhg5-induced ectopic tension suppressed it. Taken together, responses to mechanical stimulation differ among neuroectodermal tissues. It is plausible that mechanical stimulation does not regulate NP formation, but regulates NC formation.
In Plekhg5-expressing embryos, the Foxd3- and Slug-expressing region expanded toward the ectopic contraction (Fig. 3B). This suggests that the region to be potentially specified into NC by molecular regulation may be wider than actual NC, and is not specified into NC without tension. An aspiration assay using Plekhg5-expressing embryos suggested that tension is enhanced only around the ectopic contraction (Fig. S4 D-F). Consistently, NC expansion was only observed in embryos that had the contraction near the NC (data not shown), suggesting that tension upregulates these signals only where cells are subjected to a proper magnitude of tension.
Mechanism(s) to establish localized activation of morphogen-mediated signaling have been proposed. For instance, this is achieved by intracellular positive or negative feedback regulation (Eldar et al., 2003; Tsukano et al., 2022; Watanabe et al., 2018; Yamamoto et al., 2022), and accumulation of a ligand by expressing a type of heparan sulfate (Han et al., 2005; Yamamoto et al., 2023b; Yamamoto et al., 2023) in specific cells. We propose that mechanical force serves as an additional mechanism to locally activate signaling pathways, i.e., activating them only in a region (NC) adjacent to a shrinking region (NP). This regulation can be employed in other developmental processes that have region-specific force.
The Pax3-expressing region expanded toward ectopic contraction in Plekhg5-expressing embryos (Fig. S4 H,J), and was reduced in BB-injected embryos (Fig. S5H). Considering that Pax3 is required for inducing NC gene expression (Hong and Saint-Jeannet, 2007; Sato et al., 2005), these results suggest that mechanical force enhances NC induction by enhancing Pax3 expression. However, force application after Pax3 expression, such as centrifugation at st. 13, also increased NC induction (Fig. 2C). In general, it is thought that ectodermal cells lose competency during neuroectodermal patterning (Ahrens and Schlosser, 2005; Pieper et al., 2012). Our results show that ectodermal cells at early neural stage still possess potency to become other ectodermal tissues (Bronner-Fraser and Fraser, 1988; Streit and Stern, 1999), and that mechanical force is one additional cue to specify NC from non-NC cells. There are other possibilities, including that mechanical force enhances cell proliferation of NC cells. To examine these possibilities, further experiments need to be performed.
This study showed that physiological force, minute mechanical tension, regulates neuroectodermal patterning in vivo. Such tension is generated at various stages of embryogenesis, and regulates tissue specification. In culture systems, low efficiency of differentiation is a major challenge. Mimicking the in vivo mechanical environment, focusing on minute force in development, may improve efficiency, which would overcome a major challenge in regenerative medicine.
Materials and Methods
Xenopus embryo manipulation and microinjection
All animal experiments were approved by the Office for Life Science Research Ethics and Safety, at the University of Tokyo. Manipulation of Xenopus embryos and microinjection experiments were carried out according to standard methods, as previously described (Sive et al., 2000). Briefly, unfertilized eggs were obtained from female frogs injected with gonadotropin, and artificially fertilized with testis homogenate. Fertilized eggs were de-jellied with 4.6% L-cysteine-HCl solution (pH 7.8), and incubated in 1/10 × Steinberg’s solution at 14-20 ºC. Embryos were staged as reported (Nieuwkoop and Faber, 1994). Amounts of injected mRNAs are described in figure legends.
In experiments that involved centrifugation, whole embryos were centrifuged at st. 13-15 (about 3 hours) with 200 or 450 × g. Since some embryos were asymmetrically deformed, we excluded them and collected only those with their NP facing upward. In experiments that involved tissue cutting, ectoderm and mesoderm were cut at st. 13 with a tungsten needle and tweezers, to about 1/4 of the embryo diameter.
Myosin inhibition
A chemical inhibitor Blebbistatin (BB) was used. We set 100 μM as the maximum concentration of BB of the injected solution, which causes gastrulation failure (Kim et al., 2015) (for details, see Fig. S5 B-C).
Plasmid and RNA construction
Plekhg5 and Paraxis was cloned from Xenopus cDNA (template RNA of which was extracted from mid-neurula embryos) by PCR with a standard protocol, using pairs of primers, Plekhg5_cF and Plekhg5_cR, or Paraxis_F and Paraxis_R. The product was inserted into pCSf107mT vector (pCSf107-Plekgh5, pCSf107_Paraxis). The sequence of AaXKR was cut out of pAc5.1-EGFP-AaXKR (Shiomi et al., 2021) (gifted from Drs. Kohjiro Nagao and Masato Umeda) using restriction enzymes, EcoRI and XbaI, and inserted into pCSf107mT vector (pCSf107-AaXKR). mRNAs were transcribed in vitro using an mMessage mMachine SP6 kit (Thermo). All primers for cloning are listed in Table 1.
Table 1
Primers for cloning
| Name | Sequence |
|---|---|
| Plekhg5_cF | CGGGATCCACCATGAAAGAGAAGGCAGTAGTCTT |
| Plekhg5_cR | CCGCTCGAGTTACACCTCTGAAGCCGTTAAT |
| Paraxis_F | GGAATTCAGAAATAAATGCCCCGTTGGAG |
| Paraxis_R | GCTCTAGACCCAGCCGTGCCCACC |
Aspiration assay
Aspiration assay methodology was based on a previous study (Kimura-Yoshida et al., 2018) with modifications of the internal diameter of the glass needle and the applied negative pressure. To optimize conditions, we examined several parameters, and found that when the diameter of the needle was too small, aspirated tissue was easily broken, and when the diameter was too large, the difference in aspirated length of the tissue was difficult to detect. We determined that 150 μm was an appropriate needle diameter. To determine the appropriate negative pressure, we varied negative pressure from 2 to 14 kPa. Aspirated length with each pressure is shown in Fig. S1A. When the applied negative pressure > 14 kPa embryos were wholly aspirated into the glass needle and were destroyed. From these preliminary experiments, we decided to perform experiments at 10 kPa negative pressure.
During aspiration, embryos were placed so that the yolk plug was positioned on the outer edge of embryo outline in dorsal view. Aspiration was performed on a medio-lateral line, which is the perpendicular bisector of the midline, at five points as shown in Fig. 1B.
The glass needle was connected to a pneumatic microinjector (IM-11-2, Narishige) and a digital manometer (KDM30, Krone). The needle was placed in contact with the target tissue. Specimens were observed with a stereomicroscope (SZX12, Olympus), and the length of aspirated tissue was calculated with Fiji software (ImageJ 1.53f51; Java 1.8.0_172 (64-bit)) (Schindelin et al., 2012).
Atomic force microscopy (AFM)
Vitelline membrane of embryos was manually removed with tweezers. Specimens were placed in a hole in 2% agarose. A customized AFM (Fujii et al., 2019; Fujii et al., 2021) was used to map relative height (H) and apparent Young’s modulus (E). The AFM was mounted on an upright optical microscope (Eclipse FN1, Nikon) with a liquid-immersion objective lens (CFI Plan Fluor 10X, Nikon) for the optical lever system. A rectangular cantilever (Biolever-mini, BL-AC40TS-C2, Olympus) with a nominal spring constant of < 0.1 N/m was used. Two silica beads with a radius R of ca. 3.5 μm (Fine Sphere, Nippon Electric Glass) were arranged in tandem from the AFM tip with epoxy glue (2082C, ThreeBond) to achieve well-defined contact geometry and to prevent contact between the cantilever beam and the sample surface (Fujii et al., 2021). The loading force, F, was determined using Hooke’s law by multiplying the cantilever deflection by the spring constant, calibrated using a thermal fluctuation method.
AFM force measurements were performed in Steinberg’s solution at 18 ºC, with a piezo-scanner system (P-622, Physik Instruments) controlled with LabVIEW software (National Instruments). The sample stage approached the cantilever at a constant speed of 3.0 × 102 μm/s until a maximum loading force of less than 4 nN. The scan range was 420 μm × 60 μm or 240 μm × 60 μm with a spacing of 3 μm. The E of the sample was estimated from approach force-distance curves using a modified Hertz contact model (Fujii and Okajima, 2019):
where δ is the indentation depth, θ is the tilt angle of the sample surface in the contact area during indentation, and ν is the Poisson’s ratio of sample, which was assumed to be 0.5. The tilt angle θ was estimated from H images: H images in horizontal axes of x and y were fitted into polynomial functions, and θ as functions of x and y was estimated by calculating θ = arctan|∇H| with the fitted function, where ∇H = (dH/dx, dH/dy).
To correlate the measured region with each tissue, we measured distances of NP, NPB, and epidermis from midlines of embryos. Phalloidin staining of measured embryos showed that NP, which shows a strong signal, is about 0-125 μm from the embryo midline. We performed immunohistochemistry against PAX3, an NPB marker, and SOX3, an NP marker with neurulae, which vitelline membrane was removed in the same method as AFM measurement. Nuclear localization of PAX3 revealed that the width of NPB is about 100 μm, and that of SOX3 revealed that the width of NP is about 125 μm (Fig. S1F). Therefore, we used this set of lateral coordinates as an index to presume the position of each tissue.
Whole-mount in situ hybridization
Whole-mount in situ hybridization was performed based on standard Xenopus methods (Harland, 1991) with slight modifications in durations of washes, a hybridization temperature of 65 °C, and a concentration of anti-digoxigenin of 1:5000. In some experiments, embryos were fixed after AP reaction in modified picric-acid-free Bouin’s Solution (25% formaldehyde, 5% acetic acid), and bleached.
Plasmids for RNA probes were linearized and transcribed in vitro using a DIG RNA labeling mix (Roche). Enzymes for RNA probe synthesis are listed in Table 2.
Table 2
Enzymes for RNA probe synthesis
| Target | Restriction enzyme | Transcription enzyme | Reference |
|---|---|---|---|
| Foxd3 | EcoRI | T7 | (Matsukawa et al., 2015) |
| Slug | SpeI | T7 | (Matsukawa et al., 2015) |
| Sox3 | EcoRI | T3 | (Nitta et al., 2006) |
| Krt12.4 | BamHI | T7 | (Watanabe et al., 2018) |
| Pax3 | XhoI | T3 | (Matsukawa et al., 2015) |
| Paraxis | EcoRI | T7 | This study |
Western blotting
Embryos were homogenized in Lysis Buffer (0.1% CHAPS, 150 mM NaCl, 5 mM EDTA, 20 mM Tris–HCl (pH 7.4), protease inhibitor cocktail (Roche)) by sonication. Proteins were separated on 10% SDS-PAGE gels, and transferred to nitrocellulose membranes. Membranes were blocked with Bullet Blocking One solution (Nakalai Tesque), and then incubated with primary antibodies: anti-tubulin (1:1000, ab44928, Abcam), anti-α-Tubulin (1:1000, ab4074, Abcam), anti-pERK1/2 (1:1000, #9106, Cell Signaling Technology), which were diluted with Can Get Signal solution 1 (Toyobo). Each membrane was incubated with anti-rabbit or anti-mouse AP. Primary and secondary antibodies were diluted with Can Get Signal solution 2 (Toyobo), and signals were visualized with an AP reaction using NBT/BCIP (Roche).
RT-qPCR
Total mRNA was extracted with ISOGEN II (Nippon Gene). Reverse transcription was carried out using SuperScript III Reverse Transcriptase (Invitrogen). RT-qPCR was performed using KAPA SYBR Fast qPCR Kit (KAPA Biosystems). Embryos used for qPCR were bilaterally injected Blebbistatin or AaXKR mRNA. Primers for RT-qPCR are listed in Table 3.
Table 3
Primers for RT-qPCR
| Name | Sequence |
|---|---|
| Ef1alpha_qF | ACCCTCCTCTTGGTCGTTTT |
| Ef1alpha_qR | AGACCAATCCTCCACCACTG |
| Foxd3_qF | CGTAACTGGAATGACCCTGTC |
| Foxd3_qR | CCTTACCCTCTGCCTCAG |
| Slug_qF | TCCCCAGCCTGACATCTACA |
| Slug_qR | AGAGGGGAGAGATCACTGGG |
| Sox2_qF | CTGCGTCCAACAACCAGAATAAG |
| Sox2_qR | CCTCGTCGATGAAGGGTCTTTTC |
| Krt12.4_qF | CACCAGAACACAGAGTAC |
| Krt12.4_qR | CAACCTTCCCATCAACCA |
| Axin2_qF | ATGAAAAAGCATCACCGAGAAACTG |
| Axin2_qR | GGAACAAATGTGCTGGTTGG |
Immunohistochemistry
Xenopus embryos were fixed with MEMFA (0.1 M MOPS, pH 7.4, 2 mM EGTA, 1 mM MgSO4, 3.7% formaldehyde) for 1.5-2 h at room temperature, and incubated in distilled water for 10 min to remove vitelline membranes. Then, embryos were washed with PBT (0.2% Triton X-100 in PBS). Blocking was carried out in 2% BSA/PBT for 2 h at room temperature. Then, anti-β-catenin (1:500, C2206, Sigma-Aldrich), anti-PAX3 (1:200, AB_528426, DSHB), anti-SOX3 (1:200, DA5H6, DSHB) was added and embryos were incubated overnight at 4ºC. After washing embryos with PBT, anti-mouse/rabbit-Alexa488 (1:1000) was added and embryos were incubated overnight at 4ºC. After incubation, embryos were washed with PBT, and stored in PBS at 4ºC.
Confocal imaging
Specimens were observed with a confocal microscope (FV-1200, Olympus). Signal intensity of β-catenin in the nucleus or on the cell membrane (in cells within 5 cells of the NP edge) (Fig. 6 B-G), and cell size in Phalloidin-stained embryos (Fig. S5 D-F) were measured with Fiji software (Schindelin et al., 2012). Raw images were used for quantifications. Width of PAX3- and SOX3- positive region was measured in embryos whose vitelline membrane was removed in the same method as AFM measurement. The width was measured at antero-posterior coordinates, where NP width starts to expand, according to nuclear signal of PAX3 and SOX3 (examples are shown in Fig. S1 C-D).
Supplementary Material
Acknowledgements
We thank Dr. Chiharu Kimura-Yoshida (Osaka Women’s and Children’s Hospital, Japan) for methodology of the aspiration assay, Drs. Kohjiro Nagao and Masato Umeda (Kyoto University, Japan) for providing the AaXKR plasmid, Mr. Ryo Hesaka (Hokkaido University) for assistance with AFM measurements, Mr. Yuichiro Nakagiri (University of Tokyo, Japan) for help in starting this work, and Dr. Steven D. Aird for technical editing of the manuscript.
Abbreviations
NC, neural crest ; NP, neural plate ; NPB, neural plate border ;Declarations
Conflicts of interest
The authors declare no conflict of interest.
Competing interests
The authors declare no competing or financial interests.
Author contributions
TKa, TY, and TM conceived this project; TKa, MO, and TY performed all experiments except AFM experiments; YT, YM, TKo, and TO performed AFM measurements and the data analysis with TKa, MO, TY, and TM.
Funding
This work was supported in part by MEXT/JSPS KAKENHI (19H04948 and 18H04967 to TM, 19K16138 to TY, 18K06244, 21K06183, and 23K05791 to TY and TM, 21K18886 to TO), JST SPRING (JPMJSP2108 to TKa), Grant-in-Aid for JSPS Fellows (23KJ0625 to TKa), JST-CREST (JP22712622 to TO), Narishige Zoological Science Award (to TY). We also thank National BioResource Project (NBRP) and NBRP Information Center (National Institute for Genetics) for providing the Xenopus genomic database (http://viewer.shigen.info/Xenopus).
Data availability
All relevant data can be found within the article and its supplementary information.
References
Ahrens K., Schlosser G. (2005). Tissues and signals involved in the induction of placodal Six1 expression in Xenopus laevis. Developmental Biology 288: 40-59.
Aybar M. J., Nieto M. A., Mayor R. (2003). Snail precedes Slug in the genetic cascade required for the specification and migration of the Xenopus neural crest . Development 130: 483-494.
Bouwmeester T., Kim S.H., Sasai Y., Lu B., Robertis E. M. D. (1996). Cerberus is a head-inducing secreted factor expressed in the anterior endoderm of Spemann's organizer. Nature 382: 595-601.
Bronner-Fraser M., Fraser S. E., (1988). Cell lineage analysis reveals multipotency of some avian neural crest cells. Nature 335: 161-164.
Brugmann S. A., Pandur P. D., Kenyon K. L., Pignoni F., Moody S. A. (2004). Six1 promotes a placodal fate within the lateral neurogenic ectoderm by functioning as both a transcriptional activator and repressor. Development 131: 5871-5881.
Eldar A., Rosin D., Shilo B.Z., Barkai N. (2003). Self-Enhanced Ligand Degradation Underlies Robustness of Morphogen Gradients. Developmental Cell 5: 635-646.
Elosegui-Artola A., Andreu I., Beedle A. E.M., Lezamiz A., Uroz M., Kosmalska A. J., Oria R., Kechagia J. Z., Rico-Lastres P., Le Roux A.L., Shanahan C. M., Trepat X., Navajas D., Garcia-Manyes S., Roca-Cusachs P. (2017). Force Triggers YAP Nuclear Entry by Regulating Transport across Nuclear Pores. Cell 171: 1397-1410.e14.
Engler A. J., Sen S., Sweeney H. L., Discher D. E. (2006). Matrix Elasticity Directs Stem Cell Lineage Specification. Cell 126: 677-689.
Fujii Y., Koizumi W. C., Imai T., Yokobori M., Matsuo T., Oka K., Hotta K., Okajima T. (2021). Spatiotemporal dynamics of single cell stiffness in the early developing ascidian chordate embryo. Communications Biology 4: 341.
Fujii Y., Ochi Y., Tuchiya M., Kajita M., Fujita Y., Ishimoto Y., Okajima T. (2019). Spontaneous Spatial Correlation of Elastic Modulus in Jammed Epithelial Monolayers Observed by AFM. Biophysical Journal 116: 1152-1158.
Fujii Y., Okajima T. (2019). Calibrating the Young’s modulus of soft materials with surface tilt angle measured by atomic force microscopy. AIP Advances 9: 015028.
Garcı́a-Castro M. I., Marcelle C., Bronner-Fraser M. (2002). Ectodermal Wnt Function as a Neural Crest Inducer. Science 297: 848-851.
Han C., Yan D., Belenkaya T. Y., Lin X. (2005). Drosophila glypicans Dally and Dally-like shape the extracellular Wingless morphogen gradient in the wing disc . Development 132: 667-679.
Harland R. M. (1991). Appendix G: In Situ Hybridization: An Improved Whole-Mount Method for Xenopus Embryos. In Xenopus laevis: Practical Uses in Cell and Molecular Biology. (Ed. Kay B. K., Peng H. B., ) Elsevier.
Hashimoto Y., Kinoshita N., Greco T. M., Federspiel J. D., Jean Beltran P. M., Ueno N., Cristea I. M. (2019). Mechanical Force Induces Phosphorylation-Mediated Signaling that Underlies Tissue Response and Robustness in Xenopus Embryos. Cell Systems 8: 226-241.e7.
Heisenberg C.P., Bellaïche Y. (2013). Forces in Tissue Morphogenesis and Patterning. Cell 153: 948-962.
Hirano S., Mii Y., Charras G., Michiue T. (2022). Alignment of the cell long axis by unidirectional tension acts cooperatively with Wnt signalling to establish planar cell polarity. Development 149: dev200515.
Hirano S., Yamamoto T., Michiue T. (2018). FRET-based tension measurement across actin-associated mechanotransductive structures using Lima1. The International Journal of Developmental Biology 62: 631-636.
Hong C.S., Park B.Y., Saint-Jeannet J.P. (2008). Fgf8a induces neural crest indirectly through the activation of Wnt8 in the paraxial mesoderm. Development 135: 3903-3910.
Hong C.S., Saint-Jeannet J.P. (2007). The Activity of Pax3 and Zic1 Regulates Three Distinct Cell Fates at the Neural Plate Border. Molecular Biology of the Cell 18: 2192-2202.
Inoue Y., Suzuki M., Watanabe T., Yasue N., Tateo I., Adachi T., Ueno N. (2016). Mechanical roles of apical constriction, cell elongation, and cell migration during neural tube formation in Xenopus. Biomechanics and Modeling in Mechanobiology 15: 1733-1746.
Kim K., Ossipova O., Sokol S. Y. (2015). Neural Crest Specification by Inhibition of the ROCK/Myosin II Pathway. Stem Cells 33: 674-685.
Kimura-Yoshida C., Mochida K., Nakaya M., Mizutani T., Matsuo I. (2018). Cytoplasmic localization of GRHL3 upon epidermal differentiation triggers cell shape change for epithelial morphogenesis. Nature Communications 9: 4059.
Kinoshita N., Hashimoto Y., Yasue N., Suzuki M., Cristea I. M., Ueno N. (2020). Mechanical Stress Regulates Epithelial Tissue Integrity and Stiffness through the FGFR/Erk2 Signaling Pathway during Embryogenesis. Cell Reports 30: 3875-3888.e3.
Kinoshita N., Yamamoto T. S., Yasue N., Takagi C., Fujimori T., Ueno N. (2022). Force-dependent remodeling of cytoplasmic ZO-1 condensates contributes to cell-cell adhesion through enhancing tight junctions. iScience 25: 103846.
Kwon H.J., Bhat N., Sweet E. M., Cornell R. A., Riley B. B. (2010). Identification of Early Requirements for Preplacodal Ectoderm and Sensory Organ Development. PLoS Genetics 6: e1001133.
Lamb T. M., Knecht A. K., Smith W. C., Stachel S. E., Economides A. N., Stahl N., Yancopolous G. D., Harland R. M. (1993). Neural Induction by the Secreted Polypeptide Noggin. Science 262: 713-718.
Litsiou A., Hanson S., Streit A. (2005). A balance of FGF, BMP and WNT signalling positions the future placode territory in the head. Development 132: 4051-4062.
Matsukawa S., Miwata K., Asashima M., Michiue T. (2015). The requirement of histone modification by PRDM12 and Kdm4a for the development of pre-placodal ectoderm and neural crest in Xenopus. Developmental Biology 399: 164-176.
Mayor R., Morgan R., Sargent M. G. (1995). Induction of the prospective neural crest of Xenopus . Development 121: 767-777.
Milet C., Monsoro-Burq A. H. (2012). Neural crest induction at the neural plate border in vertebrates. Developmental Biology 366: 22-33.
Morita H., Kajiura-Kobayashi H., Takagi C., Yamamoto T. S., Nonaka S., Ueno N. (2012). Cell movements of the deep layer of non-neural ectoderm underlie complete neural tube closure in Xenopus . Development 139: 1417-1426.
Nieuwkoop P. D., Faber J., (1994). Normal Table of Xenopus laevis (Daudin): A Systematical and Chronological Survey of the Development from the Fertilized Egg till the End of Metamorphosis. Garland Publishing.
Nitta K. R., Takahashi S., Haramoto Y., Fukuda M., Onuma Y., Asashima M. (2006). Expression of Sox1 during Xenopus early embryogenesis. Biochemical and Biophysical Research Communications 351: 287-293.
Pieper M., Ahrens K., Rink E., Peter A., Schlosser G. (2012). Differential distribution of competence for panplacodal and neural crest induction to non-neural and neural ectoderm. Development 139: 1175-1187.
Pla P., Monsoro-Burq A. H. (2018). The neural border: Induction, specification and maturation of the territory that generates neural crest cells. Developmental Biology 444: S36-S46.
Popov I. K., Ray H. J., Skoglund P., Keller R., Chang C. (2018). The RhoGEF protein Plekhg5 regulates apical constriction of bottle cells during gastrulation. Development 145: dev168922.
Sakuragi T., Kosako H., Nagata S. (2019). Phosphorylation-mediated activation of mouse Xkr8 scramblase for phosphatidylserine exposure. Proceedings of the National Academy of Sciences 116: 2907-2912.
Sasai N., Mizuseki K., Sasai Y. (2001). Requirement of FoxD3 -class signaling for neural crest determination in Xenopus . Development 128: 2525-2536.
Sasai Y. (1994). Xenopus chordin: A novel dorsalizing factor activated by organizer-specific homeobox genes. Cell 79: 779-790.
Sato T., Sasai N., Sasai Y. (2005). Neural crest determination by co-activation of Pax3 and Zic1 genes in Xenopus ectoderm . Development 132: 2355-2363.
Schindelin J., Arganda-Carreras I., Frise E., Kaynig V., Longair M., Pietzsch T., Preibisch S., Rueden C., Saalfeld S., Schmid B., Tinevez J.Y., White D. J., Hartenstein V., Eliceiri K., Tomancak P., Cardona A. (2012). Fiji: an open-source platform for biological-image analysis. Nature Methods 9: 676-682.
Shiomi A., Nagao K., Yokota N., Tsuchiya M., Kato U., Juni N., Hara Y., Mori M. X., Mori Y., Ui-Tei K., Murate M., Kobayashi T., Nishino Y., Miyazawa A., Yamamoto A., Suzuki R., Kaufmann S., Tanaka M., Tatsumi K., Nakabe K., Shintaku H., Yesylevsky S., Bogdanov M., Umeda M. (2021). Extreme deformability of insect cell membranes is governed by phospholipid scrambling. Cell Reports 35: 109219.
Sive H. L., Grainger R. M., Harland R. M., (2000). Early Development of Xenopus laevis: A Laboratory Manual. CSHL Press.
Steventon B., Araya C., Linker C., Kuriyama S., Mayor R. (2009). Differential requirements of BMP and Wnt signalling during gastrulation and neurulation define two steps in neural crest induction. Development 136: 771-779.
Streit A., Stern C. D. (1999). Establishment and maintenance of the border of the neural plate in the chick: involvement of FGF and BMP activity. Mechanisms of Development 82: 51-66.
Suzuki J., Imanishi E., Nagata S. (2014). Exposure of Phosphatidylserine by Xk-related Protein Family Members during Apoptosis. Journal of Biological Chemistry 289: 30257-30267.
Suzuki M., Morita H., Ueno N. (2012). Molecular mechanisms of cell shape changes that contribute to vertebrate neural tube closure. Development, Growth & Differentiation 54: 266-276.
Thiery A. P., Buzzi A. L., Hamrud E., Cheshire C., Luscombe N. M., Briscoe J., Streit A. (2023). scRNA-sequencing in chick suggests a probabilistic model for cell fate allocation at the neural plate border. eLife 12: 82717.
Tsukano K., Yamamoto T., Watanabe T., Michiue T. (2022). Xenopus Dusp6 modulates FGF signaling to precisely pattern pre-placodal ectoderm. Developmental Biology 488: 81-90.
Watanabe T., Yamamoto T., Tsukano K., Hirano S., Horikawa A., Michiue T. (2018). Fam46a regulates BMP-dependent pre-placodal ectoderm differentiation in Xenopus . Development 145: dev166710.
Wolpert L. (1969). Positional information and the spatial pattern of cellular differentiation. Journal of Theoretical Biology 25: 1-47.
Xue X., Sun Y., Resto-Irizarry A. M., Yuan Y., Aw Yong K. M., Zheng Y., Weng S., Shao Y., Chai Y., Studer L., Fu J. (2018). Mechanics-guided embryonic patterning of neuroectoderm tissue from human pluripotent stem cells. Nature Materials 17: 633-641.
Yamamoto T., Kambayashi Y., Otsuka Y., Afouda B. A., Giuraniuc C., Michiue T., Hoppler S. (2022). Positive feedback regulation of frizzled-7 expression robustly shapes a steep Wnt gradient in Xenopus heart development, together with sFRP1 and heparan sulfate. eLife 11: e73818.
Yamamoto T., Kambayashi Y., Tsukano K., Michiue T. (2023a). Ndst1, a heparan sulfate modification enzyme, regulates neuroectodermal patterning by enhancing Wnt signaling in Xenopus . Development, Growth & Differentiation 65: 153-160.
Yamamoto T., Kaneshima T., Tsukano K., Michiue T. (2023b). The heparan sulfate modification enzyme, Hs6st1, governs Xenopus neuroectodermal patterning by regulating distributions of Fgf and Noggin. Developmental Biology 496: 87-94.
Yamashita S., Tsuboi T., Ishinabe N., Kitaguchi T., Michiue T. (2016). Wide and high resolution tension measurement using FRET in embryo. Scientific Reports 6: 28535.