Int. J. Dev. Biol. 69: 81 - 90 (2025)
Promoter strength delimits enhancer threshold in the early Drosophila embryo
Open Access | Original Article | Published: 13 June 2025
Abstract
The enhancer threshold is defined as the minimum concentration of transcription factors (TFs) required to elicit an enhancer response in a given time and space. Here, evidence is presented that the enhancer threshold is relative to promoter strength in the early Drosophila embryo. The apparently inactive even-skipped (eve) minimal stripe element (MSE), in which a single Hunchback (Hb)-binding site is deleted, is functionally complemented by the hsp70 promoter in transgenic embryos. Forced pause release of RNA polymerase II (Pol II) and transcription bubble assays show that both eve and heat shock protein 70 (hsp70) promoters exhibit paused Pol II. However, bioinformatics analyses and transient transfection assays indicate that the strength of the hsp70 promoter is much stronger than that of the eve promoter. Consistently, inactive MSE function is also restored by promoters stronger than the eve promoter. It is conceivable that the functional complementarity between enhancer and promoter strengths defines the enhancer threshold, thus determining whether a genomic locus acts as an enhancer for a particular promoter.
Keywords
Drosophila, embryo, enhancer threshold, enhancer-promoter complementarity
Introduction
Although there are some quantitative differences in binding strength, chromatin immunoprecipitation (ChIP) followed by DNA microarray or deep sequencing analyses have shown that most genomic regions are occupied by various TFs except for the minority of dense heterochromatic regions (Li et al., 2008; MacArthur et al., 2009; Kaplan et al., 2011). However, not all genomic loci to which TFs bind show cis-regulatory activity (Zinzen et al., 2009). Moreover, even among loci containing clusters of different ChIP-binding peaks in close proximity, only a small fraction can function as transcriptional enhancers (Zinzen et al., 2009). The inability to discriminate clusters of functional ChIP-binding peaks from the non-functional is presumably due to our lack of understanding of the minimal requirements between trans- and cis-acting elements for enhancer activity.
Traditionally, enhancer activity has been explained by the differential affinity hypothesis (Driever et al., 1989). This hypothesis is based on the concept of the enhancer threshold, which is defined as the minimum concentration of TFs required to elicit an enhancer response at a given time and space. According to this hypothesis, the biochemical affinity between the enhancer and the TFs determines the transcription initiation from its dedicated promoter (Jiang and Levine, 1993). Therefore, any factors that can influence the interaction between an enhancer and TFs, such as a change in the quality of the TF-binding sites within the enhancer or a change in the concentration of TFs, can redefine enhancer activity. In other words, if the concentration of trans-acting elements is fixed in a particular time and space, the enhancer threshold will also remain constant unless the nucleotide sequence of the enhancer changes.
We present evidence that promoter strength delimits the enhancer threshold at a given time and space in the early Drosophila embryo. Transgenic embryo assays, biochemical and in silico analyses show that the defective eve MSE, which has lost its activity, is functionally complemented by a hsp70 promoter that is stronger than the eve promoter. eve is one of the pair-rule genes expressed in seven transverse stripes along the anterior-posterior (AP) axis of the early developing embryo (Harding et al., 1986; Small et al., 1991; Small et al., 1992). The MSE is the minimal cis-acting element controlling eve expression in the second stripe of the seven (Small et al., 1992). The eve gene is activated by maternal TFs, Bicoid (Bcd) and Hb, in almost the anterior half of the embryo along the AP axis (Small et al., 1991), while its expression is restricted within the second strip by transcription repressors, Krüppel (Kr) and Giant (Gt) binding to the MSE (Arnosti et al., 1996; Small et al., 1991). Inactive MSE function is consistently restored by promoters that are stronger than the eve promoter. These results suggest that the functional complementarity between enhancer and promoter strength defines the minimum affinity between enhancers and TFs for productive transcription. Presumably, the enhancer-promoter (EP) complementarity acts through a particular conformation of the massive protein complex formed at the interface between enhancers and promoters, thus determining whether a genomic locus acts as an enhancer for a particular promoter.
Results and Discussion
Activity of the defective MSE relative to the hsp70 promoter
We examined the relative activity of the eve stripe 2 MSE (Small et al., 1992) in transgenic Drosophila embryos 2-4 hours after egg deposition (AED). The MSE is a 480 bp region of the eve enhancer that is sufficient to drive the expression of a lacZ gene within the normal limits of the endogenous eve stripe 2. When the MSE was placed upstream of the eve (Small et al., 1992) and hsp70 (Table S1) promoters, it activated the transcription of lacZ from both (Fig. 1 A,B). The MSE contains a Hb-binding site (Hb3) (Fig. 1C), which plays a critical role along with a nearby Bcd-binding site (Bcd1) in Bcd-Hb cooperativity (Arnosti et al., 1996). Consistently, mutations introduced into the Hb3 (Fig. 1D) almost completely abolished lacZ transcription from the eve promoter (Fig. 1E). The severe reduction in lacZ transcription was completely restored by replacing the eve promoter with the hsp70 promoter (Fig. 1F). These results suggest that the apparent inactivity of the MSE is functionally complemented by the hsp70 promoter, resulting in productive transcription.

Fig. 1. The inactive eve minimal stripe element (MSE) function was completely restored by the hsp70 promoter.
MSE (A,B) and MSEΔHb3 (E,F) were placed upstream of the eve and hsp70 promoters in the P-element transformation vector pCaSpeR (Thummel et al., 1988). The lacZ fusion genes were expressed in transgenic embryos after P-element-mediated germline transformation (Rubin and Spradling, 1982). 2-4 hour AED transgenic embryos were hybridized with an antisense lacZ RNA probe and visualized by immunohistochemical staining. (C) Organization of the enhancer which contains 5 Bcd-binding sites (B1-B5), 1 Hb site (H3), and 3 binding sites for each of the two repressors, Gt (G1-G3) and Kr (K3-K5). The full-length eve stripe 2 enhancer has been reported previously (Small et al., 1991). (D) Several nucleotide substitutions in the single hunchback (Hb) binding site in MSE were generated by site-directed mutagenesis. The enhancer and promoter parts of the transformation vector are depicted at the top of each panel. Solid and open arrowheads indicate lacZ expression activated by eve enhancers and unknown sequences of the P-element transformation vector pCaSpeR (Small et al., 1992), respectively. Substituted nucleotides in the Hb3 (ΔHb3) site are shown in gray lowercase.
Pause release from the eve and hsp70 promoters within the eve stripe 2
What was the difference between the two promoters that produced such disparate outcomes to the defective MSE? The first feasible difference to test was the presence of paused Pol II in its canonical position, because the hsp70 promoter is a known paused promoter (Kwak et al., 2013), whereas it is unclear whether the eve promoter has a paused Pol II. Previous studies have shown that positive transcription elongation factor b (P-TEFb) is necessary and sufficient for the release of paused Pol II in vitro (Bieniasz et al., 1999; Lis et al., 2000), suggesting that the paused Pol II can also be released into productive elongation in vivo by cyclin-dependent kinase 9 (CDK9), a component of P-TEFb. P-TEFb is composed of CDK9 and cyclin T (Fujinaga et al., 2023). Since cyclin T is constitutively expressed, ectopic expression of CDK9 is sufficient to generate P-TEFb activity (Lis et al., 2000). Thus, we hypothesized that the pause release by tethering of CDK9 near a promoter in the early embryo could serve as an in vivo assessment of a functional paused Pol II.
To test if the eve promoter has a paused Pol II, an ectopic CDK9 gradient along the AP axis of the early embryo was created. The coding sequence for CDK9 fused with the GAL4 DNA binding domain (GAL4) (Lis et al., 2000) was placed between the hsp83 promoter and the bcd 3’ untranslated region (UTR) (Arnosti et al., 1996) (Fig. 2A). This caused the chimeric GAL4:CDK9 mRNA to mimic the bcd mRNA gradient (Fig. 2B) and be expressed at a similar concentration to Bcd in the eve stripe 2 domain (Fig. 2C). As expected, both wild-type (WT) (Fig. 2D) and mutant (Fig. 2E) versions of GAL4:CDK9 mRNA were most abundant in the head region, progressively decreased along the AP axis of the embryo, and were no longer observed near the middle of the embryo. Male flies from several independent lines carrying lacZ fusions with an upstream activating sequence (UAS) were individually crossed with females carrying the WT or mutant versions of GAL4:CDK9 (Fig. 2 F-I). Artificial attachment of GAL4:CDK9 upstream of the eve promoter in the presence of MSEΔHb3 resulted in weak lacZ transcription in the stripe 2 domain (Fig. 2F). In contrast, GAL4:CDK9 strongly activated lacZ transcription from the hsp70 promoter in almost the anterior three-fifths of the embryo along the AP axis except for some head regions (Fig. 2H). The expression of mutant GAL4:CDK9, in which the 199th aspartic acid was changed to asparagine (Lis et al., 2000), did not influence the activity of either promoter (Fig. 2 G,I). These results suggest that CDK9, with the help of a defective enhancer, succeeded in releasing the paused Pol II from both promoters at least within the eve stripe 2 domain.

Fig. 2. Response of eve and hsp70 promoters to P-TEFb artificially bound in their vicinity.
(A) WT and mutant versions of GAL4:CDK9 coding regions were placed between the hsp83 promoter and bcd 3’ UTR. In the mutant GAL4: CDK9 coding region, the 199th aspartic acid was replaced by asparagine. The GAL4:CDK9 mRNA gradient (C) distributed along the AP axis recapitulates the endogenous bcd mRNA gradient (B) in the early embryo. In situ hybridization was performed using antisense RNA probes against GAL4 DNA binding domain (D,E). Male flies carrying a lacZ reporter with an upstream activating sequence (UAS) were crossed with females carrying the WT or mutant GAL4:CDK9 fusion (F-I). Two copies of the UAS were inserted between the MSEΔHb3 and the promoter (see the diagram above each panel). The mutant GAL4:CDK9 (GAL4:CDK9/D199N) had no effect on the activity of either promoter (G,I). Solid and open arrowheads are as described in Fig. 1.
Artificial recruitment of CDK9 is a necessary and sufficient for pause release in vitro (Bieniasz et al., 1999; Lis et al., 2000), as mentioned previously. Consistently, tethered GAL4:CDK9 was also functionally necessary and sufficient for the pause release from the hsp70 promoter in early embryos, even in the presence of the short-range repressors, Gt and Kr (Fig. 2H). It has been widely accepted that Gt and Kr repress transcription by blocking nearby synergistic cooperativity between activators (Arnosti et al., 1996) and recruiting C-terminal binding protein (CtBP) (Nibu et al., 1998). However, exactly how this short-range repression works is still unknown. This successful efficacy of the tethered CDK9 on pause release completely bypassed Gt and Kr activity. It is conceivable that the short-range repression mediated by Gt and Kr functions chronologically somewhere upstream of the Serine (Ser)-2 phosphorylation within a heptapeptide of Pol II c-terminal domain (CTD). If the short-range repressors function somewhere downstream of Ser-2 phosphorylation, it is evident that the recruitment of CDK9 was not functionally effective in pause release.
As always, one answered question raises another; why did the GAL4:CDK9 fail to bypass Gt and Kr for pause release from the eve promoter? Two possibilities should be considered; the presence or absence of paused Pol II in the eve promoter. The second possibility should be immediately ruled out because lacZ transcription was restored by the tethered GAL4:CDK9 within the eve stripe 2, suggesting that the tethered P-TEFb activity caused pause release from the eve promoter, at least within this region. The simplest explanation for the first possibility is that there is likely a difference in the response to P-TEFb activity between the paused Pol II in the hsp70 and eve promoters. Pol II pausing can be considered in two broad categories based on its location and distribution: proximal and focused (Prox), and distal and dispersed (Dist) (Kwak et al., 2013). More core promoter elements (CPEs) are concentrated in more precise positions on Prox promoters than on Dist promoters. The mechanistic differences may have regulatory consequences, as the presence and quality of CPE strongly correlate with promoter functionality (Juven-Gershon et al., 2006; Qi et al., 2022). There are four CPEs in the hsp70 promoter, while the eve promoter contains only the TATA box (Fig. 5 and Table S2). More importantly, it is quite different how paused genes respond to genetic perturbation (Boettiger and Levine, 2009). The paused gene, rhomboid (rho), shows synchronous activation in the neurogenic ectoderm of WT embryos, whereas stochastic induction in Dorsal heterozygous (dl/+) embryos. In contrast, a synchronous induction pattern is consistently observed at the locus of another paused gene, short-gastrulation (sog), in both WT and mutant embryos. Taken together, it is plausible that the failure to bypass Gt and Kr in the eve promoter outside of eve stripe 2 is at least in part due to the differences in mechanistic features and activation pattern of paused Pol II.
Pause release from paused promoters within the eve stripe 2
The lack of pause release from the eve promoter by GAL4:CDK9 outside the eve stripe 2 domain still raises the question of whether the eve promoter has paused Pol II or not. To test whether CDK9 recruitment can also facilitate the pause release from other paused promoters, the effect of GAL4:CDK9 expression on known non-paused and paused promoters was examined (Fig. 3). All experiments are identical to Fig. 2 (F-I) except for the replacement of the promoter. As expected, the non-paused Abdominal B (Abd-B) promoter did not respond to the upstream tethered GAL4:CDK9 (Fig. 3A). The responses of the paused engrailed (en) and fushi tarazu (ftz) promoters to GAL4-CDK9 appeared to be similar to that of the hsp70 promoter (Fig. 3 E,G), except for more posterior expansion of lacZ transcription from the en promoter (Fig. 3E). The lacZ transcription from the en and ftz promoters was activated in the presence the MSEΔHb3 without the CDK9 activity (Fig. 3 F,H), although the restoration appears to be weaker than that of the hsp70 promoter (Fig. 1F). However, the Abd-B and rho promoters did not respond to the MSEΔHb3 in the absence of the CDK9 activity (Fig. 3 B,D). Unexpectedly, the GAL4:CDK9 also failed to release the paused Pol II from the rho promoter (Fig. 3C), one of the best known paused promoters (Zeitlinger et al., 2007). These results suggest that tethered CDK9 has the ability to cause paused release from paused promoters in vivo, but also that an additional way is needed to verify whether the eve promoter has paused Pol II.
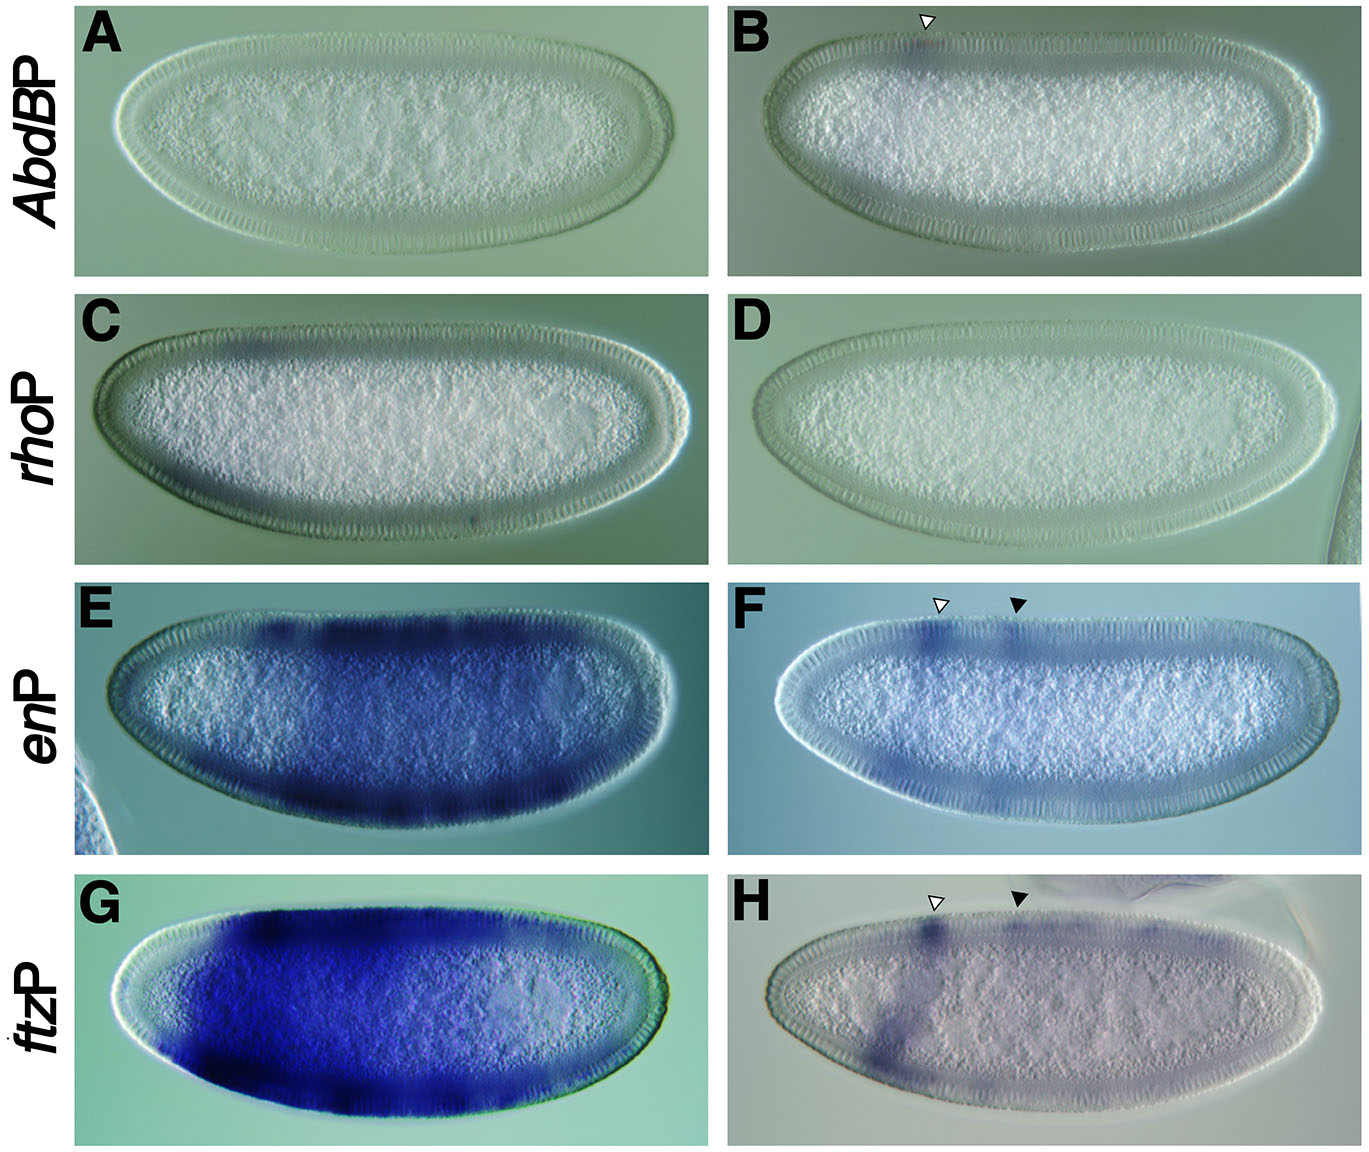
Fig. 3. Responses of paused promoters to tethered GAL4:CDK9.
The promoter of the pCaSpeR-MSEΔHb3-UAS-eveP construct was replaced with one of the promoters of Abd-B (A,B), rho (C,D), en (E,F) or ftz (G,H) (Table S1). All of them, except Abd-B, are known as a paused promoters (Zeitlinger et al., 2007; Hendrix et al., 2008). All experiments are identical to Fig. 2 F-I, except for the replacement of the promoter. Consistent with the results in Fig. 2 G,I, the mutant GAL4:CDK9/D199N did not influence the activity of any of the promoters. Solid and open arrowheads indicate lacZ expression activated by the MSEΔHb3 enhancer and unknown sequences of the P-element transformation vector (Small et al., 1992), respectively.
In reporter gene assays using transgenic embryos, the rho promoter was not responsive to either MSEΔHb3 or tethered CDK9. How can we interpret the insensitivity of the rho promoter to any activation stimuli? The three promoters of hsp70, en, and ftz that have responded to both MSEDHb3 and tethered CDK9 share two common features; first, they each have at least one GAGA site within 50 bp upstream of the TSS (Fig. 5) and second, initiator (Inr) and a downstream promoter element (DPE) or pause button (PB). In contrast, the rho promoter shares only Inr with these three promoters (Fig. 5). GAGA-associated factor (GAF) is a pioneer factor that renders a nearby promoter nucleosome-free, making it more accessible to other trans-acting factors (Wilkins and Lis, 1997). Inr and DPE/PB play a critical role in the high attractiveness of transcription factor IID (TFIID) (Fant et al., 2020), which is a hallmark of a strong promoter (Juven-Gershon et al., 2006). It is possible that the open-structured hsp70, en, and ftz promoters strongly attracted the preinitiation complex (PIC) with exposed Inr and DPE/PB, while the relatively closed-structured rho promoter was unable to strongly recruit PIC despite having its sufficiently low E-value (Table S2). Therefore, this accessibility issue may have made the rho promoter more susceptible to subtle fluctuations in activation stimulus. The observation that the genetic perturbation that halves the Dl concentration (Boettiger and Levine, 2009) in early fly embryos almost completely abolishes synchronous rho expression supports this possibility. Overall, it may be the case that more comprehensive activation mediated by a typical enhancer such as the wild-type MSE is required for productive transcription from the rho promoter, since the promoter opening appears to depend on enhancer activity (Beagrie and Pombo, 2016).
Transcription bubble assays identified hypersensitive residues in both the eve and hsp70 promoters
To further test whether the eve promoter has a paused Pol II, the potassium permanganate (KMnO4) transcription bubble assay (Wang et al., 2005; Wang et al., 2007) was performed with WT (yw67c23) and three mutant, Toll10b, Tollrm9/rm10, and gd7 (Hendrix et al., 2008), 2-4 hour AED embryos (Fig. 4, S1 and S2). These three mutant embryos are composed of cells from the mesoderm, neurogenic ectoderm and dorsal ectoderm, respectively. As a result, the patterning genes of the early three germ layers are expressed throughout the embryo, thereby providing a suitable genetic background to demonstrate that the transcription bubble generated by stably paused Pol II is independent of genetic diversity and gene expression status (Fig. S1). For example, rho is expressed only in the neurogenic and dorsal ectoderm (Fig. S1C), but its pausing pattern is identical in all mutant embryos regardless of its expression (Fig. S1 A,B). This result suggests that if eve were a paused gene, the similar bubble pattern would be also found in WT (yw) and the mutant embryos. The KMnO4 bubble assay, which localizes the transcription bubble, shows that the eve promoter, like the hsp70 promoter (Fig. 4 A,B), has a very distinct bubble band 42 base pairs (bp) downstream of the transcription start site (TSS) (Fig. 4 C,D). Although precision nuclear run-on sequencing (PRO-seq) analysis (Hunt et al., 2024) show that nascent RNAs are detected throughout the eve transcription unit in all mutant embryos (Fig. 4E), the higher RNA peak identified at the eve 5’ end strongly supports the idea that the eve promoter has a paused Pol II. In general, the intensity of Pol II near the paused promoter is more than four times greater than the median Pol II occupancy observed throughout the rest of the transcription unit, even when the gene is being expressed (Zeitlinger et al., 2007). The peaks of nascent RNA near the eve promoter appear to be at least five times higher than the median intensity observed across the eve transcription unit regardless of its expression (Fig. 4E). Taken together, since it is reasonable to assume that both the eve and hsp70 promoters have paused Pol II, it is difficult to postulate that the different responses of the two promoters to MSEΔHb3 are solely due to paused Pol II.
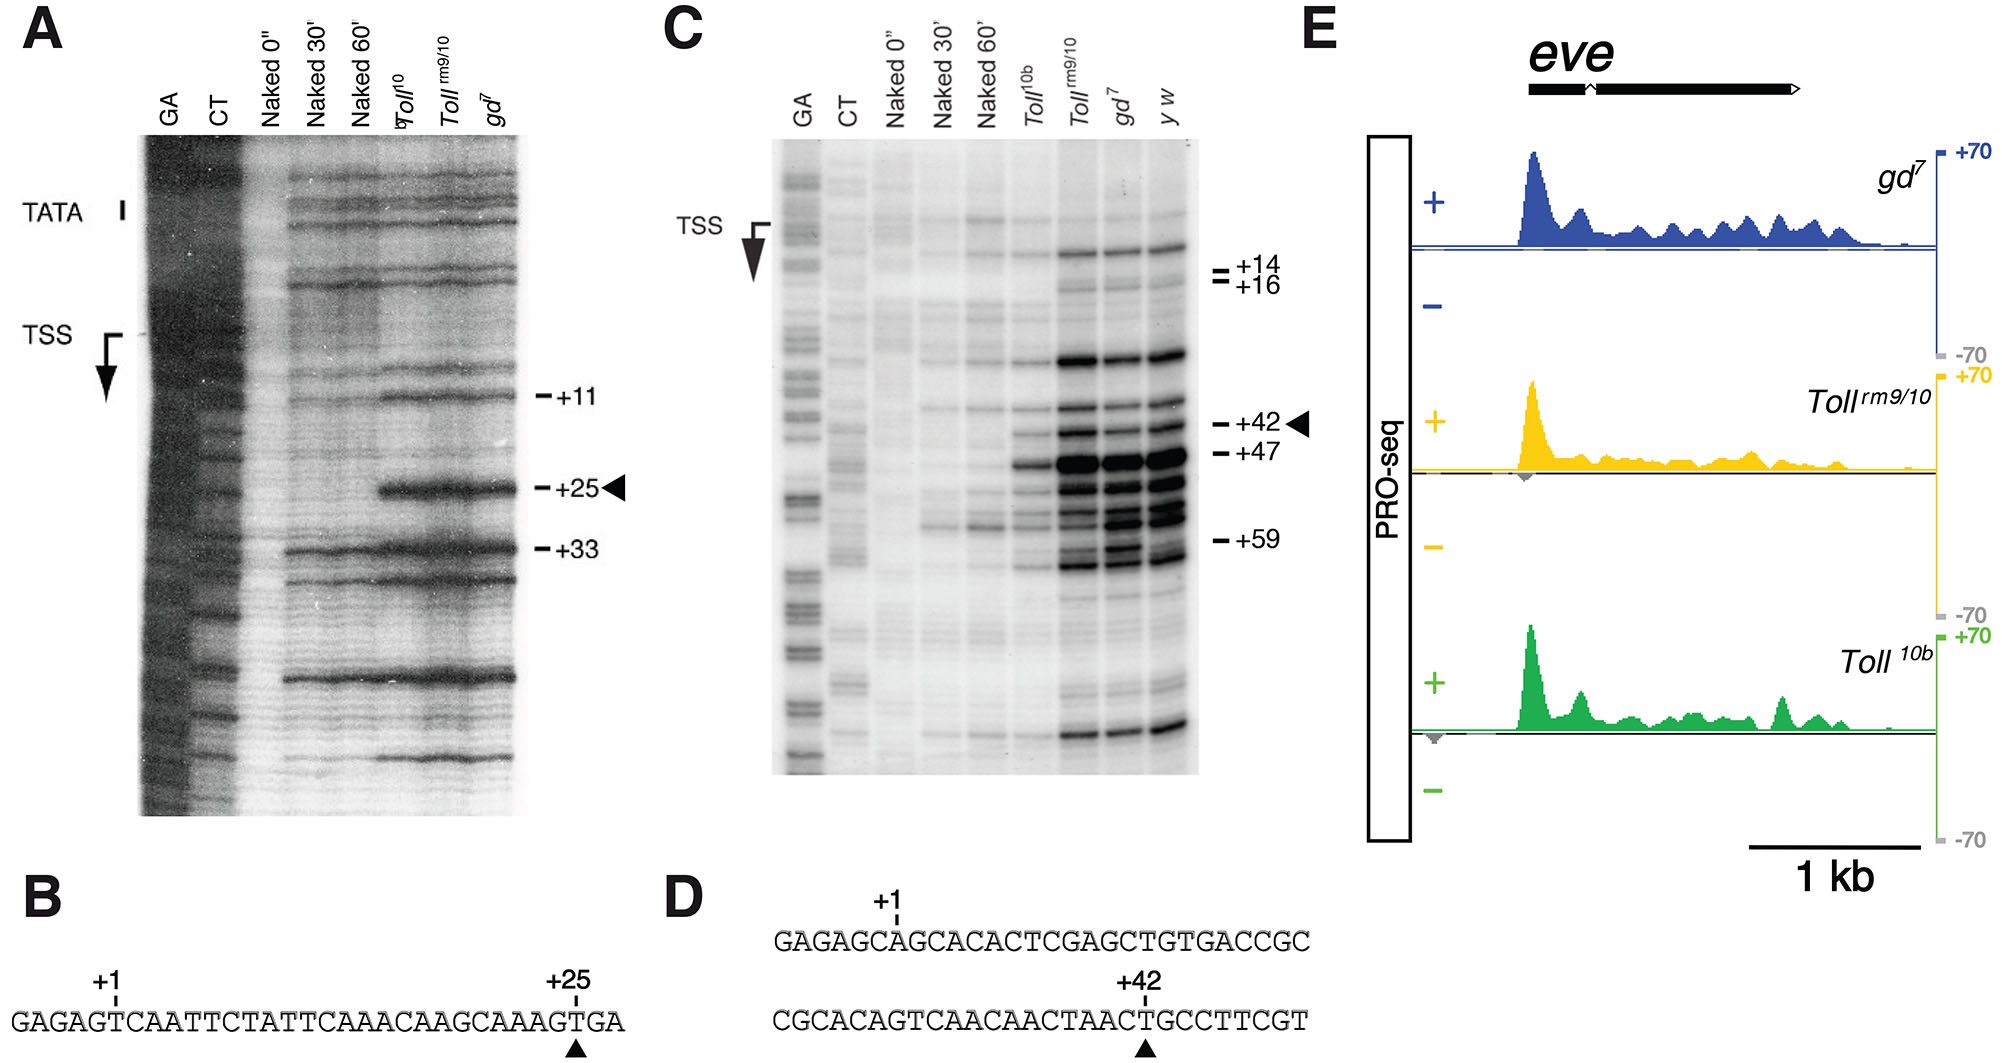
Fig. 4. A KMnO4 transcription bubble assay.
Transcription bubble assays were performed for hsp70A (A,B) and eve (C,D,E) in WT (yw67c23) and three mutant (Toll10b, Tollrm9/rm10, and gd7) 2-4 h AED embryos (Fig. S2). The transcription start sites (TSSs) are labeled on the left and the location of prominent bands relative to the TSS (+1) is shown on the right of the autoradiograms. Genomic sequences of G+A and C+T are shown as size markers. As a control, purified genomic DNA from yw embryos was either not treated (Naked 0”) or treated (Naked 30” and 60”) with 20 mM KMnO4 for 30 and 60 seconds. Solid arrowheads indicate significant pyrimidine residues (T) modified only in chromatin isolated from yw and three mutant embryos by KMnO4 treatment, implying the existence of transcription bubbles in vivo (A,C). Promoter sequences downstream of TSS were presented (B,D). Results of precision nuclear run-on sequencing (PRO-seq) analysis (Hunt et al., 2024) on the eve locus (E) are shown. + and – represent the mean PRO-seq intensity for sense and antisense strands, respectively, in three mutant embryos. Gene prediction model is displayed above the graphical presentation.
The hsp70 promoter is stronger than the eve promoter
If not paused Pol II, what else could cause the difference in complementarity of the eve and hsp70 promoters to defective MSEΔHb3? The composition of the CPEs in the hsp70 promoter is significantly different from that of the eve promoter (Fig. 5 and Table S2). The hsp70 promoter contains the four elements of the TATA box, Inr, motif ten element (MTE), and PB (Kwak et al., 2013), while only the TATA box was identified in the eve promoter (Read et al., 1990). In particular, the CPE composition of the hsp70 promoter is reminiscent of Super Core Promoter 1 (SCP1) (Juven-Gershon et al., 2006), an artificially synthesized promoter containing the TATA box, Inr, MTE and DPE (Fig. 5 and Table S2). The SCP1 is stronger than a cytomegalovirus IE1 core promoter, one of the strongest promoters in mammalian cells (Qin et al., 2010). Furthermore, the hsp70 promoter contains at least six GAGA sites within a region up to 150 bp upstream of the TSS, but only one GAGA site was identified within a 1 kb region surrounding the eve TSS (Fig. 5) (Adato et al., 2024). These findings suggest that the two promoters have significant differences in RNA production and chromosomal structure, which prompted us to quantify their promoter strengths in silico and in vitro.
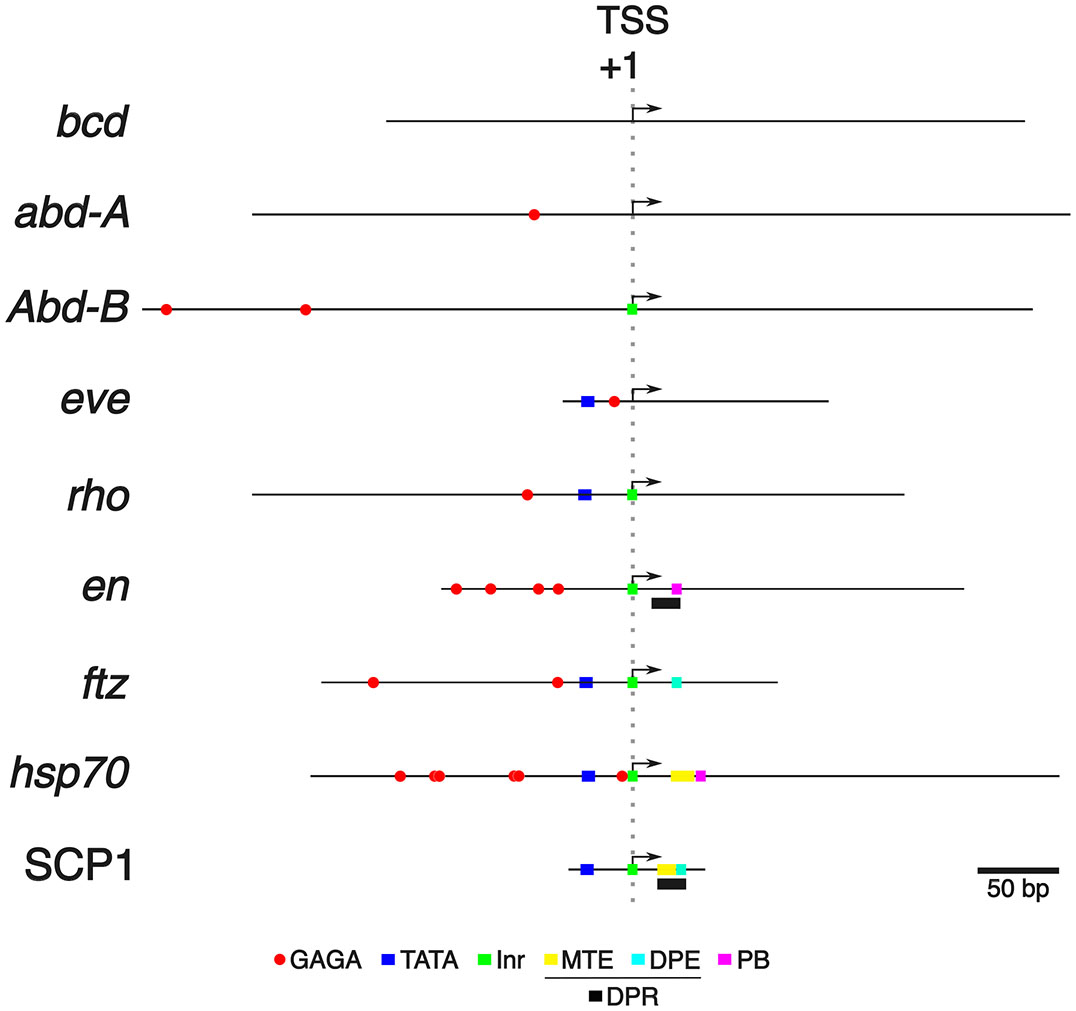
Fig. 5. The composition of the GAGA sites and the core promoter elements (CPEs) in the promoters that were examined in this study.
Various promoters examined in this study (Table S1) were drawn in scale and arranged according to the transcription start site (TSS) (+1). The third nucleotide of Inr and the 5’ end of the mRNA of the Flybase (https://flybase.org) gene model were designated as TSSs in the presence and absence of Inr, respectively. CPEs (Table S2) were identified by feeding the MEME Suite 5.5.5 (Bailey et al., 2015) with the position probability matrices (PPMs) (Table S4) of CPEs.
The CPE composition of SCP1 is well documented (Fig. 5 and Table S2) and its promoter strength has been previously quantified in vitro (Juven-Gershon et al., 2006). Regression analysis between CPE composition and the rate of mRNA synthesis (Juven-Gershon et al., 2006) of SCP1 revealed a robust correlation (Pearson correlation coefficients of at least 0.8) (Fig. 6 A-D and Table S3). This suggests that the best-fit line (black dotted lines in Fig. 6) generated by the regression analysis can serve as a universal standard for estimating core promoter strength using CPE sequences alone. The relative strength of the eve and hsp70 promoters was quantified in silico by substituting the E-values (Table S2) of the CPEs found in the two promoters into the equations (Table S3) of the best-fit lines (Fig. 6 A-D) generated by the regression analyses. The relative strength of the hsp70 promoter was at least 2.5 times greater than that of the eve promoter (Fig. 6 A-D and Table S3). To confirm the in silico difference between the two promoters, transient transfection assays were performed in HEK293 cells with constructs containing either the eve or hsp70 promoters (Fig. 6 E,F). The luciferase activity generated by the hsp70 promoter without enhancer stimulation was almost three times higher than that of the eve promoter (Fig. 6E). In the presence of the SV40 enhancer, the hsp70 promoter produced almost twice as much luciferase mRNA as the eve promoter (Fig. 6F). Overall, these results suggest that the disparity in the complementarity of the eve and hsp70 promoters to defective MSEΔHb3 is at least in part due to the divergence in their promoter strengths.
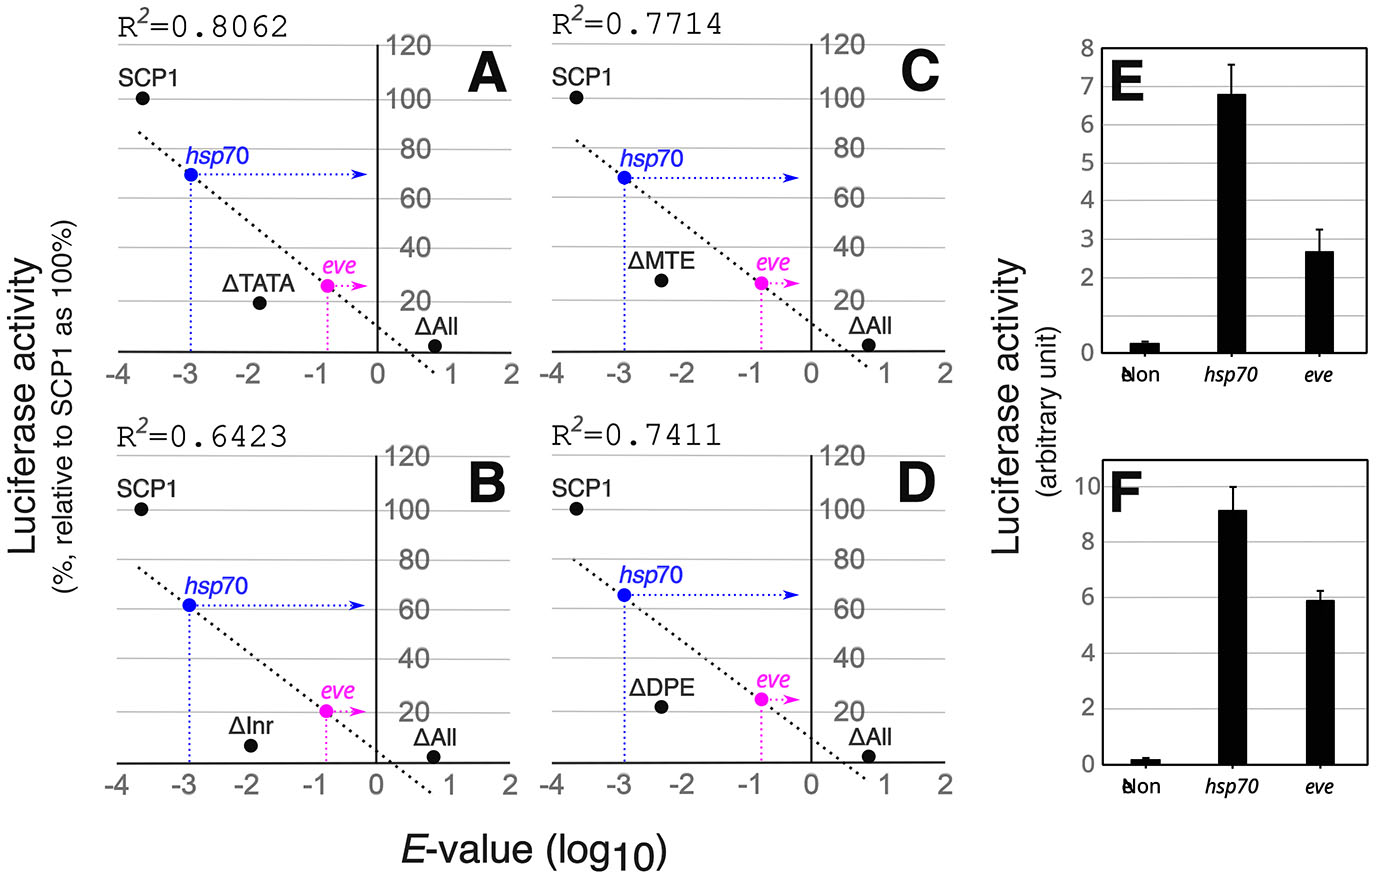
Fig. 6. The hsp70 promoter is stronger than the eve promoter.
The best-fit equations (dotted lines) (Table S3) produced by the least squares regression analyses on the SCP1 promoters were used to statistically estimate the strength of the eve and hsp70 promoters. Regression analysis indicates a robust correlation in each of the four combinations of SCP1 promoters [SCP1-SCP1ΔTATA-SCP1ΔAll (A), SCP1-SCP1ΔInr-SCP1ΔAll (B), SCP1-SCP1ΔMTE-SCP1ΔAll (C), and SCP1-SCP1ΔDPE-SCP1ΔAll (D)]. The four response variables (promoter strength) of the hsp70 promoter are at least 2.5-fold higher than the eve promoter. ΔTATA, ΔInr, ΔMTE, ΔDPE, and ΔAll stand for SCP1ΔTATA, SCP1ΔInr, SCP1ΔMTE, SCP1ΔDPE, and SCP1ΔAll, respectively, and refer to mutant versions of the TATA box, Inr, MTE, DPE, or all CPEs (Table S2). eve and hsp70 stand for their core promoters (Fig. 5 and Table S1) used in this study. R2 represents the coefficient of determination, also called R-squared, which is obtained from the least-squares regression analysis of the SCP1 promoters (Table S3). The amount of mRNA synthesized from the WT SCP1 by transient transcription (Juven-Gershon et al., 2006) is considered 100 %. The strength of RNA synthesis of all other SCP1 variants is expressed as a ratio to SCP1. To confirm the results of the regression analyses, transient transfection assays were performed in HEK293 cells with pGL3-basic (E) or pGL3-enhancer (F) constructs containing the eve and hsp70 core promoters (Fig. 5). A β-galactosidase expression plasmid was also cotransfected as a reference. The luciferase activity of each construct was normalized to the corresponding β-galactosidase activity.
Inactive MSEΔHb3 activated transcription from strong promoters
Based on the previous findings, we hypothesized that, for a given concentration of trans-acting elements, transcription initiation is determined by the combined strength of an enhancer and a promoter. To test this hypothesis, we investigated whether promoters stronger or weaker than the eve promoter are able to carry out productive transcription in conjunction with MSEΔHb3 (Fig. 7), in addition to the rho and Abd-B promoters (Fig. 3 B,D). Identical experiments to those in Figure 1E and F were repeated, except that four promoters (Fig. 5 and Table S1) with different E-values (Table S2) were used. The E-values of two promoters were higher than (Fig. 7 A,B) that of the eve promoter, while those of the other two were lower than the eve promoter (Fig. 7 C,D). Hereafter, a promoter with an E-value higher or lower than that of the eve promoter is referred to as a weak or strong promoter, respectively. As expected, the MSEΔHb3 failed to activate transcription from the weak promoters, bcd and abd-A (Fig. 7 A,B), which is consistent with Abd-B (Fig. 3B). The Abd-B promoter contained Inr, which is the only CPE identified among the bcd, abd-A, and Abd-B promoters (Fig. 5 and Table S2), suggesting their weak transcriptional strength. In contrast, MSEΔHb3 distinctly activated lacZ transcription from the en and ftz promoters (Fig. 7 C,D), although the intensities of the transcription were weaker than that of the hsp70 promoter (compare with Fig. 1F). The E-values of both promoters fall between those of the hsp70 and eve promoters but are much closer to that of the hsp70 promoter (Table S2). These results suggest that MSEΔHb3-mediated transcription activation is due, at least in part, to a combination with a stronger promoter relative to the eve promoter except for the rho promoter.

Fig. 7. The relative activity of an enhancer to the strength of its paired promoter.
Based on the functional complementarity between the MSEΔHb3 and the hsp70 promoter in eve stripe 2 domain, we hypothesized that for a given concentration of trans-acting elements, transcription initiation is determined by the combined activities of an enhancer and a promoter. In order to test this hypothesis, it was examined how two promoters weaker (A,B) or stronger (C,D) than the eve promoter respond to the MSEΔHb3. The E-values of the two weaker or stronger promoters are higher or lower, respectively, than the E-value of the eve promoter (Table S2). The same tests as in Fig. 1 were repeated except that the hsp70 promoter region was replaced by four promoters (Fig. 5 and Table S1) with different E-values. Solid and open arrowheads are as described in Fig. 1. E-value for each promoter is shown in the upper right of each panel.
Differential affinity hypothesis versus EP complementarity hypothesis
Over the past four decades of study, it has been widely accepted that neither an enhancer nor a promoter alone is capable of completing productive transcription in metazoan cells (Fig. 8C), although there are very few exceptions (Tippens et al., 2018). In the traditional view, enhancer activity is determined by the concentration of TFs at a given time and space and the quality of the TF binding sites on the enhancer to which they bind (Driever et al., 1989; Jiang and Levine, 1993) (Fig. 8A). In reality, increased binding affinities of the Dorsal and ETS binding sites in the twist and sonic hedgehog enhancers in fly and mouse embryos, respectively, resulted in the expression of the two genes in otherwise untranscribed regions (Jiang and Levine, 1993; Lim et al., 2024). Here we present evidence that this enhancer threshold response is relative to the strength of the promoter. The lost activity of the defective eve stripe 2 enhancer, in which a single Hb-binding site is disrupted, was fully complemented by promoters stronger than the eve promoter. This EP complementarity in function appears to depend more on the strength of the promoter rather than on the presence of paused Pol II. These results suggest that there is a quantitative criterion of the combined activity of enhancers and promoters for transcriptional activation (Fig. 8B). This quantitative criterion reflects a minimum level that the combined strength of the enhancer and promoter must reach or exceed for productive transcription. For example, a weak enhancer may require a strong promoter (Fig. 8 E-H), whereas a strong enhancer may be able to achieve productive transcription even with a weak promoter (Fig. 8D).

Fig. 8. Enhancer-promoter (EP) complementarity hypothesis.
According to the differential affinity hypothesis (Driever et al., 1989), transcription from a promoter is determined by the concentration of transcription factors (TFs) at a given time and space and the quality of the TF binding sites on the enhancer to which these TFs bind (A). The current study provides evidence that the enhancer threshold response can be relative to promoter strength (B). For example, the inactive eve minimal stripe element (MSE), where cooperativity between transcription activators is disrupted, requires a higher level of TFs within eve stripe 2 for productive transcription. The defective MSE is completely complemented by the hsp70 promoter stronger than the eve promoter. These results suggest that the combined strength of an enhancer and a promoter determines whether transcription is initiated or not. Since the biochemical affinity (KmE and KmP) between cis- and trans-acting elements highly correlates with their functional strength (Jiang and Levine, 1993; Juven-Gershon et al., 2006), Km, a measure of biochemical affinity, can represent the strength of the enhancer and promoter once time and space are specified. Consistently, productive transcription does not occur with either an enhancer or a promoter alone (C). A strong enhancer may be able to achieve productive transcription even with a weak promoter (D), whereas it is possible that a relatively high enhancer threshold (weak enhancer activity) (E - H) is functionally complemented by a promoter with relatively high transcriptional strength (F,H), resulting in a lower threshold. TF, GTF, Pol II and Km stand for transcription factor, general transcription factor, RNA polymerase II, and the Michaelis-Menten constant (Michaelis et al., 2011), respectively. KmE or KmP represent Km between TFs or GTFs+Pol II and an enhancer or a promoter, respectively. +(x) represents the sum or product of KmE and KmP, respectively.
If EP complementarity in function can define transcriptional firing, the decision of whether a genomic locus functions as an enhancer for a particular promoter may depend on whether their combined strength meets or exceeds the minimum requirement of the quantitative criterion (compare Fig. 8 E,G with F,H, respectively), given that EP communication is promiscuous (Bergman et al., 2022; Martinez-Ara et al., 2022) and EP contact probability is stochastic (Zuin et al., 2022).
Materials and Methods
DNA constructs
MSE (Small et al., 1992) and MSEΔHb3 (Arnosti et al., 1996) stand for the wild-type (WT) and the mutant (deletion of the Hb3 site) version of the even skipped (eve) stripe 2 minimal enhancer, respectively. pCaSpeR-MSE-2xUAS-(-42)eveP-lacZ and pCaSpeR-MSEΔHb3-2xUAS-(-42)eveP-lacZ constructs (Arnosti et al., 1996) were obtained from Michael Levine laboratory at Princeton University. The MSE-2xUAS-(-42)eveP and MSEΔHb3-2xUAS-(-42)eveP fragments were prepared by digesting pCaSpeR-MSE-2xUAS-(-42)eveP-lacZ and pCaSpeR-MSEΔHb3-2xUAS-(-42)eveP-lacZ with EcoRI and BamHI respectively and cloned into the Agilent™ pBlueScript II vector that had been cut with EcoRI and BamHI [pBSKII-MSE-2xUAS-(-42)eveP and pBSKII-MSEΔHb3-2xUAS-(-42)eveP]. All promoter regions except the eve promoter were prepared by polymerase chain reaction (PCR) with fly genomic DNA (Fig. 5 and Table S1). Genomic DNA was isolated from yw67c23 embryos aged 2-4 hours AED, using previously described methods (Hendrix et al., 2008). PCR-amplified promoters were cloned into the Promega™ pGEM®-T Easy vector and nucleotide sequences of the cloned fragments were verified by DNA sequencing reaction. Cloned promoters were digested by PstI and BamHI and cloned again into pBSKII-MSE-2xUAS-(-42)eveP and pBSKII-MSEΔHb3-2xUAS-(-42)eveP previously digested with PstI and BamHI. MSE-2xUAS-promoter and MSEΔHb3-2xUAS-promoter fragments were prepared by digsting pBSKII-MSE-2xUAS-promoter and pBSKII-MSEΔHb3-2xUAS-promoter constructs with EcoRI and BamHI, and cloned into pCaSpeR-(-42)eveP-lacZ (Small et al., 1992) previously cut with EcoRI and BamHI. The GAL4 DNA-binding domain (GAL4):CDK9 and GAL4:CDK9/D199N chimeric coding regions were amplified by PCR (Table S1) with the GAL4:CDK9 and GAL4:CDK9/D199N expression constructs (Lis et al., 2000) as a template, respectively, obtained from John Lis laboratory at Cornell University, and cloned into the pGEM-T Easy vector. A NotI fragment containing GAL4:CDK9 or GAL4:CDK9/D199N coding region from pGEM-T Easy-GAL4:CDK9 or pGEM-T Easy-GAL4:CDK9/D199N, respectively, was inserted into a NotI site of the phsp83-bcd3’UTR transformation vector (Arnosti et al., 1996; Huang et al., 1997). Promoter fragments were amplified by PCR (Table S1) and cloned into the pGEM-T easy vector. The cloned promoters were digested with NotI, filled with the Klenow fragment and cloned again into pGL3-basic and pGL3-enhancer, which were previously digested with SmaI. The orientation of all cloned fragments was confirmed by DNA sequencing reaction.
Genetic Crosses
To obtain embryos containing the MSEΔHb3 constructs and the maternal expression of GAL4:CDK9 along the AP axis, male flies from several independent lines carrying P-element transposons of the MSEΔHb3-eveP or MSEΔHb3-hsp70P construct were individually crossed with females carrying the WT or mutant versions (D199N) of GAL4:CDK9 fusion (Lis et al., 2000). Three mutant embryos [Toll10b/+, Tollrm9/Tollrm10, gastrulation defective (gd)7/gd7] were obtained as previously described (Hendrix et al., 2008). Briefly, Toll10b/+ female flies were generated directly from the balanced stock (Toll10b/+/TM3 Sb Ser and Toll10b/+/OR60). Tollrm9/Tollrm10 female flies were obtained by crossing Tollrm10/TM3 Sb females with Tollrm9/TM3 Ser males. gd7/FM3 male flies were crossed to gd7/FM3 females and embryos were collected from females homozygous for the gd7 allele (Konrad et al., 1988; Stathopoulos and Levine, 2002).
KMnO4 transcription bubble assay
A KMnO4 transcription bubble assay was performed as previously described (Hendrix et al., 2008) with a slight modification in the preparation of the embryos. Embryos were collected 2-4 hours AED, dechorinated, partially homogenized with a plastic pestle, and treated with 20 mM KMnO4 for 60 sec on ice. Transcription start site (TSS) of investigated genes were determined by annotated TSSs in Flybase and previous tiling array analysis (Biemar et al., 2006). The linker primers and gene-specific primers were used for ligation-mediated PCR (LM-PCR). All primers used for LM-PCR are listed in Table S1.
Whole-mount and fluorescent in situ hybridization
Whole-mount in situ hybridization was performed as previously described (Hong et al., 2013). Briefly, 2-4 hours AED embryos were collected, dechorinated, fixed, and hybridized with a digoxigenin (DIG)-UTP labeled antisense lacZ RNA probe. Staining the hybridized antisense lacZ RNA probe with nitro-blue tetrazolium chloride (NBT) and 5-bromo-4-chloro-3-indolyl phosphate (BCIP) was carried out for exactly 20 min to normalize expression levels. For fluorescent in situ hybridization, transgenic embryos containing the GAL4:CDK9 expression construct were hybridized with an antisense RNA probe against GAL4 DNA binding domain labeled with digoxigenin and stained with a secondary antibody conjugated with Alex Fluor 555 dye.
E-value of the CPE matches in promoter sequences
Position Probability Matrices (PPMs) of GAF-binding motif (GAGA), TATA box (TATA), Inr, Motif Ten Element (MTE), DPE, PB, and Downstream Promoter Region (DPR) were generated by modifying the reported position frequency matrices (PFMs) of GAGA (Adato et al., 2024), TATA (Gershenzon et al., 2006), Inr (Gershenzon et al., 2006), MTE (Sloutskin et al., 2015), DPE (Adato et al., 2024), PB (Hendrix et al., 2008), and DPR (Vo Ngoc et al., 2023) using Kadonaga’s Drosophila core promoter database (Kutach et al., 2000). The statistical significance of the observed matches found in a promoter DNA sequence to a set of CPE motifs was expressed as the product of the p-values of the motif matches, called combined p-value (Bailey and Gribskov, 1998). The statistical expression was calculated by MEME Suite 5.5.5 (Bailey et al., 2015) fed with PPMs of CPEs (Table S4) and the DNA sequences of core promoters (Table S1). E-value of the sequence match to a group of CPE motifs is defined as the expected number of sequences in a random sequence database of the same size that would have a combined p-value equal to or greater than the observed p-value by chance (Bailey et al., 2015). It is equal to the product of the combined p-value of the sequence and the total number of sequences in the sequence database. Thus, the E-value represents the combined statistical significance of multiple matches within the DNA sequence members present in the database.
Supplementary Material
Acknowledgements
We would like to thank Michael Levine at Princeton University and John Lis at Cornell University for their helpful discussions and DNA constructs. This work was supported by a sabbatical program funded by Kyung Hee University in 2018.
Abbreviations
abd-A, abdominal A ; Abd-B, Abdominal B ; AED, after egg deposition ; AP, anterior-posterior ; bcd, bicoid ; CDK9, cyclin-dependent kinase 9 ; ChIP, Chromatin immunoprecipitation ; CPE, core promoter elements ; EP, enhancer-promoter ; eve, even-skipped ; ftz, fushi tarazu ; GAL4, GAL4 DNA binding domain ; gt, giant ; hb, hunchback ; hsp70, heat shock protein 70 ; KMnO4, potassium permanganate ; kr, krüppel ; MSE, minimal stripe element ; P-TEFb, positive transcription elongation factor b ; PCR, polymerase chain reaction ; PPM, position probability matrix ; rho, rhomboid ; TF, transcription factor ; TSS, transcription start site ; UAS, upstream activating sequence ;Declarations
Author contributions
J.W.H. conceived and supervised this study. M.H. performed statistics and bioinformatics analyses. J.W.H. performed all experiments except statistics and bioinformatics analyses. M.H. and J.W.H. contributed to manuscript preparation.
References
Adato O., Sloutskin A., Komemi H., Brabb I., Duttke S., Bucher P., Unger R., Juven-Gershon T. (2024). ElemeNT 2023: an enhanced tool for detection and curation of core promoter elements. Bioinformatics 40: btae110.
Arnosti D. N., Barolo S., Levine M., Small S. (1996). The eve stripe 2 enhancer employs multiple modes of transcriptional synergy. Development 122: 205-214.
Bailey T. L., Gribskov M. (1998). Methods and Statistics for Combining Motif Match Scores. Journal of Computational Biology 5: 211-221.
Bailey T. L., Johnson J., Grant C. E., Noble W. S. (2015). The MEME Suite. Nucleic Acids Research 43: W39-W49.
Beagrie R. A., Pombo A. (2016). Gene activation by metazoan enhancers: Diverse mechanisms stimulate distinct steps of transcription. BioEssays 38: 881-893.
Bergman D. T., Jones T. R., Liu V., Ray J., Jagoda E., Siraj L., Kang H. Y., Nasser J., Kane M., Rios A., Nguyen T. H., Grossman S. R., Fulco C. P., Lander E. S., Engreitz J. M. (2022). Compatibility rules of human enhancer and promoter sequences. Nature 607: 176-184.
Biemar F., Nix D. A., Piel J., Peterson B., Ronshaugen M., Sementchenko V., Bell I., Manak J. R., Levine M. S. (2006). Comprehensive identification of Drosophila dorsal–ventral patterning genes using a whole-genome tiling array. Proceedings of the National Academy of Sciences 103: 12763-12768.
Bieniasz P. D., Grdina T. A., Bogerd H. P., Cullen B. R. (1999). Recruitment of cyclin T1/P-TEFb to an HIV type 1 long terminal repeat promoter proximal RNA target is both necessary and sufficient for full activation of transcription. Proceedings of the National Academy of Sciences 96: 7791-7796.
Boettiger A. N., Levine M. (2009). Synchronous and Stochastic Patterns of Gene Activation in the Drosophila Embryo. Science 325: 471-473.
Driever W., Thoma G., Nüsslein-Volhard C. (1989). Determination of spatial domains of zygotic gene expression in the Drosophila embryo by the affinity of binding sites for the bicoid morphogen. Nature 340: 363-367.
Fant C. B., Levandowski C. B., Gupta K., Maas Z. L., Moir J., Rubin J. D., Sawyer A., Esbin M. N., Rimel J. K., Luyties O., Marr M. T., Berger I., Dowell R. D., Taatjes D. J. (2020). TFIID Enables RNA Polymerase II Promoter-Proximal Pausing. Molecular Cell 78: 785-793.e8.
Fujinaga K., Huang F., Peterlin B. M. (2023). P-TEFb: The master regulator of transcription elongation. Molecular Cell 83: 393-403.
Gershenzon N. I., Trifonov E. N., Ioshikhes I. P. (2006). The features of Drosophila core promoters revealed by statistical analysis. BMC Genomics 7: 161.
Harding K., Rushlow C., Doyle H. J., Hoey T., Levine M. (1986). Cross-Regulatory Interactions Among Pair-Rule Genes in Drosophila. Science 233: 953-959.
Hendrix D. A., Hong J.W., Zeitlinger J., Rokhsar D. S., Levine M. S. (2008). Promoter elements associated with RNA Pol II stalling in the Drosophila embryo. Proceedings of the National Academy of Sciences 105: 7762-7767.
Hong J.W., Park K. W., Levine M. S. (2013). Temporal regulation of single-minded target genes in the ventral midline of the Drosophila central nervous system. Developmental Biology 380: 335-343.
Huang A. M., Rusch J., Levine M. (1997). An anteroposterior Dorsal gradient in the Drosophila embryo. Genes & Development 11: 1963-1973.
Hunt G., Vaid R., Pirogov S., Pfab A., Ziegenhain C., Sandberg R., Reimegård J., Mannervik M. (2024). Tissue-specific RNA Polymerase II promoter-proximal pause release and burst kinetics in a Drosophila embryonic patterning network. Genome Biology 25: 2.
Jiang J. (1993). Binding affinities and cooperative interactions with bHLH activators delimit threshold responses to the dorsal gradient morphogen. Cell 72: 741-752.
Juven-Gershon T., Cheng S., Kadonaga J. T. (2006). Rational design of a super core promoter that enhances gene expression. Nature Methods 3: 917-922.
Kaplan T., Li X.Y., Sabo P. J., Thomas S., Stamatoyannopoulos J. A., Biggin M. D., Eisen M. B. (2011). Quantitative Models of the Mechanisms That Control Genome-Wide Patterns of Transcription Factor Binding during Early Drosophila Development. PLoS Genetics 7: e1001290.
Konrad K. D., Goralski T. J., Mahowald A. P. (1988). Developmental genetics of the gastrulation defective locus in Drosophila melanogaster. Developmental Biology 127: 133-142.
(2000). Drosophila Core Promoter Database. https://labs.biology.ucsd.edu/Kadonaga/DCPD.htm
Kwak H., Fuda N. J., Core L. J., Lis J. T. (2013). Precise Maps of RNA Polymerase Reveal How Promoters Direct Initiation and Pausing. Science 339: 950-953.
Li X., MacArthur S., Bourgon R., Nix D., Pollard D. A., Iyer V. N., Hechmer A., Simirenko L., Stapleton M., Hendriks C. L. L., Chu H. C., Ogawa N., Inwood W., Sementchenko V., Beaton A., Weiszmann R., Celniker S. E., Knowles D. W., Gingeras T., Speed T. P., Eisen M. B., Biggin M. D. (2008). Transcription Factors Bind Thousands of Active and Inactive Regions in the Drosophila Blastoderm. PLoS Biology 6: e27.
Lim F., Solvason J. J., Ryan G. E., Le S. H., Jindal G. A., Steffen P., Jandu S. K., Farley E. K. (2024). Affinity-optimizing enhancer variants disrupt development. Nature 626: 151-159.
Lis J. T., Mason P., Peng J., Price D. H., Werner J. (2000). P-TEFb kinase recruitment and function at heat shock loci. Genes & Development 14: 792-803.
MacArthur S., Li X.Y., Li J., Brown J. B., Chu H. C., Zeng L., Grondona B. P., Hechmer A., Simirenko L., Keränen S. V.E., Knowles D. W., Stapleton M., Bickel P., Biggin M. D., Eisen M. B. (2009). Developmental roles of 21 Drosophila transcription factors are determined by quantitative differences in binding to an overlapping set of thousands of genomic regions. Genome Biology 10: R80.
Martinez-Ara M., Comoglio F., van Arensbergen J., van Steensel B. (2022). Systematic analysis of intrinsic enhancer-promoter compatibility in the mouse genome. Molecular Cell 82: 2519-2531.e6.
Michaelis L., Menten M. L., Johnson K. A., Goody R. S. (2011). The Original Michaelis Constant: Translation of the 1913 Michaelis–Menten Paper. Biochemistry 50: 8264-8269.
Nibu Y., Zhang H., Levine M. (1998). Interaction of Short-Range Repressors with Drosophila CtBP in the Embryo. Science 280: 101-104.
Qi Z., Jung C., Bandilla P., Ludwig C., Heron M., Sophie Kiesel A., Museridze M., Philippou‐Massier J., Nikolov M., Renna Max Schnepf A., Unnerstall U., Ceolin S., Mühlig B., Gompel N., Soeding J., Gaul U. (2022). Large‐scale analysis of Drosophila core promoter function using synthetic promoters. Molecular Systems Biology 18: e9816.
Qin J. Y., Zhang L., Clift K. L., Hulur I., Xiang A. P., Ren B.Z., Lahn B. T. (2010). Systematic Comparison of Constitutive Promoters and the Doxycycline-Inducible Promoter. PLoS ONE 5: e10611.
Read D., Nishigaki T., Manley J. L. (1990). The Drosophila even-skipped promoter is transcribed in a stage-specific manner in vitro and contains multiple, overlapping factor-binding sites.. Molecular and Cellular Biology 10: 4334-4344.
Rubin G. M., Spradling A. C. (1982). Genetic Transformation of Drosophila with Transposable Element Vectors. Science 218: 348-353.
Sloutskin A., Danino Y. M., Orenstein Y., Zehavi Y., Doniger T., Shamir R., Juven-Gershon T. (2015). ElemeNT: a computational tool for detecting core promoter elements. Transcription 6: 41-50.
Small S., Blair A., Levine M. (1992). Regulation of even-skipped stripe 2 in the Drosophila embryo.. The EMBO Journal 11: 4047-4057.
Small S., Kraut R., Hoey T., Warrior R., Levine M. (1991). Transcriptional regulation of a pair-rule stripe in Drosophila.. Genes & Development 5: 827-839.
Stathopoulos A., Levine M. (2002). Linear signaling in the Toll-Dorsal pathway of Drosophila : activated Pelle kinase specifies all threshold outputs of gene expression while the bHLH protein Twist specifies a subset. Development 129: 3411-3419.
Thummel C. S., Boulet A. M., Lipshitz H. D. (1988). Vectors for Drosophila P-element-mediated transformation and tissue culture transfection. Gene 74: 445-456.
Tippens N. D., Vihervaara A., Lis J. T. (2018). Enhancer transcription: what, where, when, and why?. Genes & Development 32: 1-3.
Vo Ngoc L., Rhyne T. E., Kadonaga J. T. (2023). Analysis of the Drosophila and human DPR elements reveals a distinct human variant whose specificity can be enhanced by machine learning. Genes & Development 37: 377-382.
Wang X., Lee C., Gilmour D. S., Gergen J. P. (2007). Transcription elongation controls cell fate specification in the Drosophila embryo. Genes & Development 21: 1031-1036.
Wang Y. V., Tang H., Gilmour D. S. (2005). Identification In Vivo of Different Rate-Limiting Steps Associated with Transcriptional Activators in the Presence and Absence of a GAGA Element. Molecular and Cellular Biology 25: 3543-3552.
Wilkins R. (1997). Dynamics of potentiation and activation: GAGA factor and its role in heat shock gene regulation. Nucleic Acids Research 25: 3963-3968.
Zeitlinger J., Stark A., Kellis M., Hong J.W., Nechaev S., Adelman K., Levine M., Young R. A. (2007). RNA polymerase stalling at developmental control genes in the Drosophila melanogaster embryo. Nature Genetics 39: 1512-1516.
Zinzen R. P., Girardot C., Gagneur J., Braun M., Furlong E. E. M. (2009). Combinatorial binding predicts spatio-temporal cis-regulatory activity. Nature 462: 65-70.
Zuin J., Roth G., Zhan Y., Cramard J., Redolfi J., Piskadlo E., Mach P., Kryzhanovska M., Tihanyi G., Kohler H., Eder M., Leemans C., van Steensel B., Meister P., Smallwood S., Giorgetti L. (2022). Nonlinear control of transcription through enhancer–promoter interactions. Nature 604: 571-577.