Int. J. Dev. Biol. 69: 203 - 215 (2025)
Spatiotemporal dynamics of lineage-specific epithelial maturation in the developing mouse stomach
Open Access | Developmental Expression Pattern | Published: 6 April 2026
Abstract
At birth, the gastric epithelium is immature and progressively matures during postnatal development to establish adult tissue architecture and function. Although this process has been investigated at functional, proteomic and transcriptomic levels, the precise temporal and spatial dynamics by which individual epithelial lineages initiate differentiation, exit proliferative states and establish adult homeostasis remain incompletely understood. Here, we performed a comprehensive immunofluorescence analysis of the mouse stomach from mid-gestation through adulthood, examining fetal markers, lineage-specific functional epithelial markers, and the proliferation marker KI67. By integrating functional epithelial marker expression with proliferative status, we delineated distinct maturation trajectories for pit, parietal, and chief cell lineages. Notably, parietal and chief cells exhibited a robust proliferative phase from late gestation to early postnatal stages, followed by a marked decline in proliferative activity, whereas pit cells showed the emergence of proliferative progenitors primarily during later postnatal stages. Moreover, we identified region-specific differences in the timing of maturation between the corpus and the antrum. Together, our study establishes a spatiotemporal in situ atlas of gastric epithelial maturation and provides a framework for understanding lineage- and region- specific mechanisms governing postnatal gastric development.
Keywords
stomach, epithelial cells, maturation, differentiation, proliferation
Introduction
The mouse glandular stomach is composed of two regions, the corpus and the antrum. The corpus glands contain a diverse array of epithelial cell lineages, including acid-secreting parietal cells, enzyme-secreting chief cells, mucus-producing pit and neck cells, and several endocrine cell types, whereas the antrum glands contain few parietal and chief cells (Kim and Shivdasani, 2016). As in humans, differentiation of these epithelial cells begins before birth, with the expression of lineage-specific mature functional markers detectable in late gestation (McCracken et al., 2017; Walthall et al., 2005; Willet and Mills, 2016). Nevertheless, the newborn stomach remains highly immature, characterized by short length of gastric glands and the epithelial cells that retain fetal-like morphology. After birth, the glands elongate and the numbers of functional epithelial cells progressively increase as the stomach undergoes structural and functional maturation (Keeley and Samuelson, 2010).
Previous histological, proteomic, and transcriptomic studies have demonstrated that the stomach undergoes a major functional transition during the suckling-to-weaning period, when dietary intake shifts from milk to solid food around three weeks after birth. This transition is accompanied by marked changes in the functional components of gastric epithelium. For example, the expression of prochymosin, a pepsinogen involved in milk-clotting activity (Kageyama, 2002; Yoneda et al., 2001), is high from late gestation through early postnatal stages but declines by approximately three weeks after birth (Li et al., 2018). Similarly, the fatty acid receptors GPR84 and GPR120, which are implicated in sensing high-fat content of maternal milk, are highly expressed during the suckling period and then decrease during weaning (Widmayer et al., 2017). In contrast, mature functional markers, including the chief-cell-derived pepsinogen PGC and the parietal-cell-specific proton pump subunits ATP4A and ATP4B, are sharply upregulated around three weeks after birth (Li et al., 2018), coinciding with a pronounced increase in mature chief and parietal cell numbers (Keeley and Samuelson, 2010). These observations indicate that differentiation and maturation of gastric epithelial cells accelerate markedly during the weaning period. However, emerging evidence suggests that postnatal maturation does not proceed uniformly across all gastric epithelial lineages. For example, recent transcriptomic profiling of mucus-secreting pit cells has revealed multiple discrete postnatal transitions at weeks 1–2, 2–3, and 3–4, characterized by stepwise changes in gene expression, suggesting that pit cells follow a maturation program distinct from those of other gastric epithelial lineages (Wei et al., 2023). Despite these insights, the detailed timing and sequence by which each functional epithelial lineage initiates, progresses and completes differentiation and maturation have not been fully clarified.
In addition to differentiation, precise regulation of epithelial proliferation is essential for proper gastric development. In the adult corpus, KI67-positive proliferating stem cells are confined to the isthmus region, where they differentiate into pit, neck, and parietal cells and thereby maintain epithelial homeostasis (Han et al., 2019; Matsuo et al., 2021). In contrast, during mid-gestation, KI67-positive cells are broadly distributed throughout the gastric epithelium (Kim et al., 2011). Even during the suckling-to-weaning period when differentiation of multiple lineages is ongoing, KI67-positive cells are not yet confined to the isthmus region, but remain widely distributed along the glands (Mesquita da Silva et al., 2021). However, it remains unclear how the timing of loss of proliferative activity relates to the onset of lineage-specific functional marker expression during these developmental stages.
Here, we performed comprehensive immunofluorescence analysis of fetal and lineage-specific functional epithelial markers in the stomach from mid-gestation to adulthood, in combination with a proliferation marker KI67. By mapping the onset of lineage marker expression, the downregulation of fetal markers, and the temporal dynamics of proliferative activity within lineage-positive cells, we identified distinct developmental sequences across pit, parietal, chief, and endocrine cell lineages. Moreover, we found region-specific differences in maturation between the corpus and the antrum. Together, these analyses establish a spatiotemporal framework for lineage- and region-specific development of the gastric epithelium from fetal, postnatal to adult stages.
Results
Fetal marker expression in the developing stomach
SOX2 and SOX9 are transcription factors prominently expressed in the embryonic gastric epithelium and serve as key regulators of epithelial growth and differentiation. SOX2 is essential for gastric growth, as evidenced by the reduced stomach size in SOX2-deficient mice (Francis et al., 2019; Teramoto et al., 2020), while SOX9 deletion leads to the absence of neck cells in the adult stomach (Willet et al., 2023). In our immunostaining analysis, both SOX2 and SOX9 were detectable in epithelial cells of corpus and antrum as early as E12.5 (Fig. 1 A,B). Interestingly, from E14.5 onward, SOX2 and SOX9 exhibited opposing yet non-exclusive expression gradients along the gland axis in both corpus and antrum: SOX2 was enriched in the luminal side, whereas SOX9 was mainly detected in the bottom of the developing gastric glands (Fig. 1 A,B and Fig. S1). This complementary expression pattern was transient in the corpus: SOX2 expression weakened after P7, while SOX9 expression at the gland base diminished after P7 and subsequently shifted toward the middle part of the glands (Fig. 1C). In contrast, the antrum maintained this complementary expression pattern up to 10 weeks, although SOX2 expression at the gland surface became attenuated from P7 (Fig. 1D). Notably, during embryonic development, the antral epithelium tended to be thicker than that of the corpus, reaching statistical significance at multiple mid-to-late embryonic stages, and also exhibited earlier formation of immature gland-like structure at E14.5, although the corpus ultimately develops longer glands than the antrum in the adult stomach tissue (Fig. 1E).
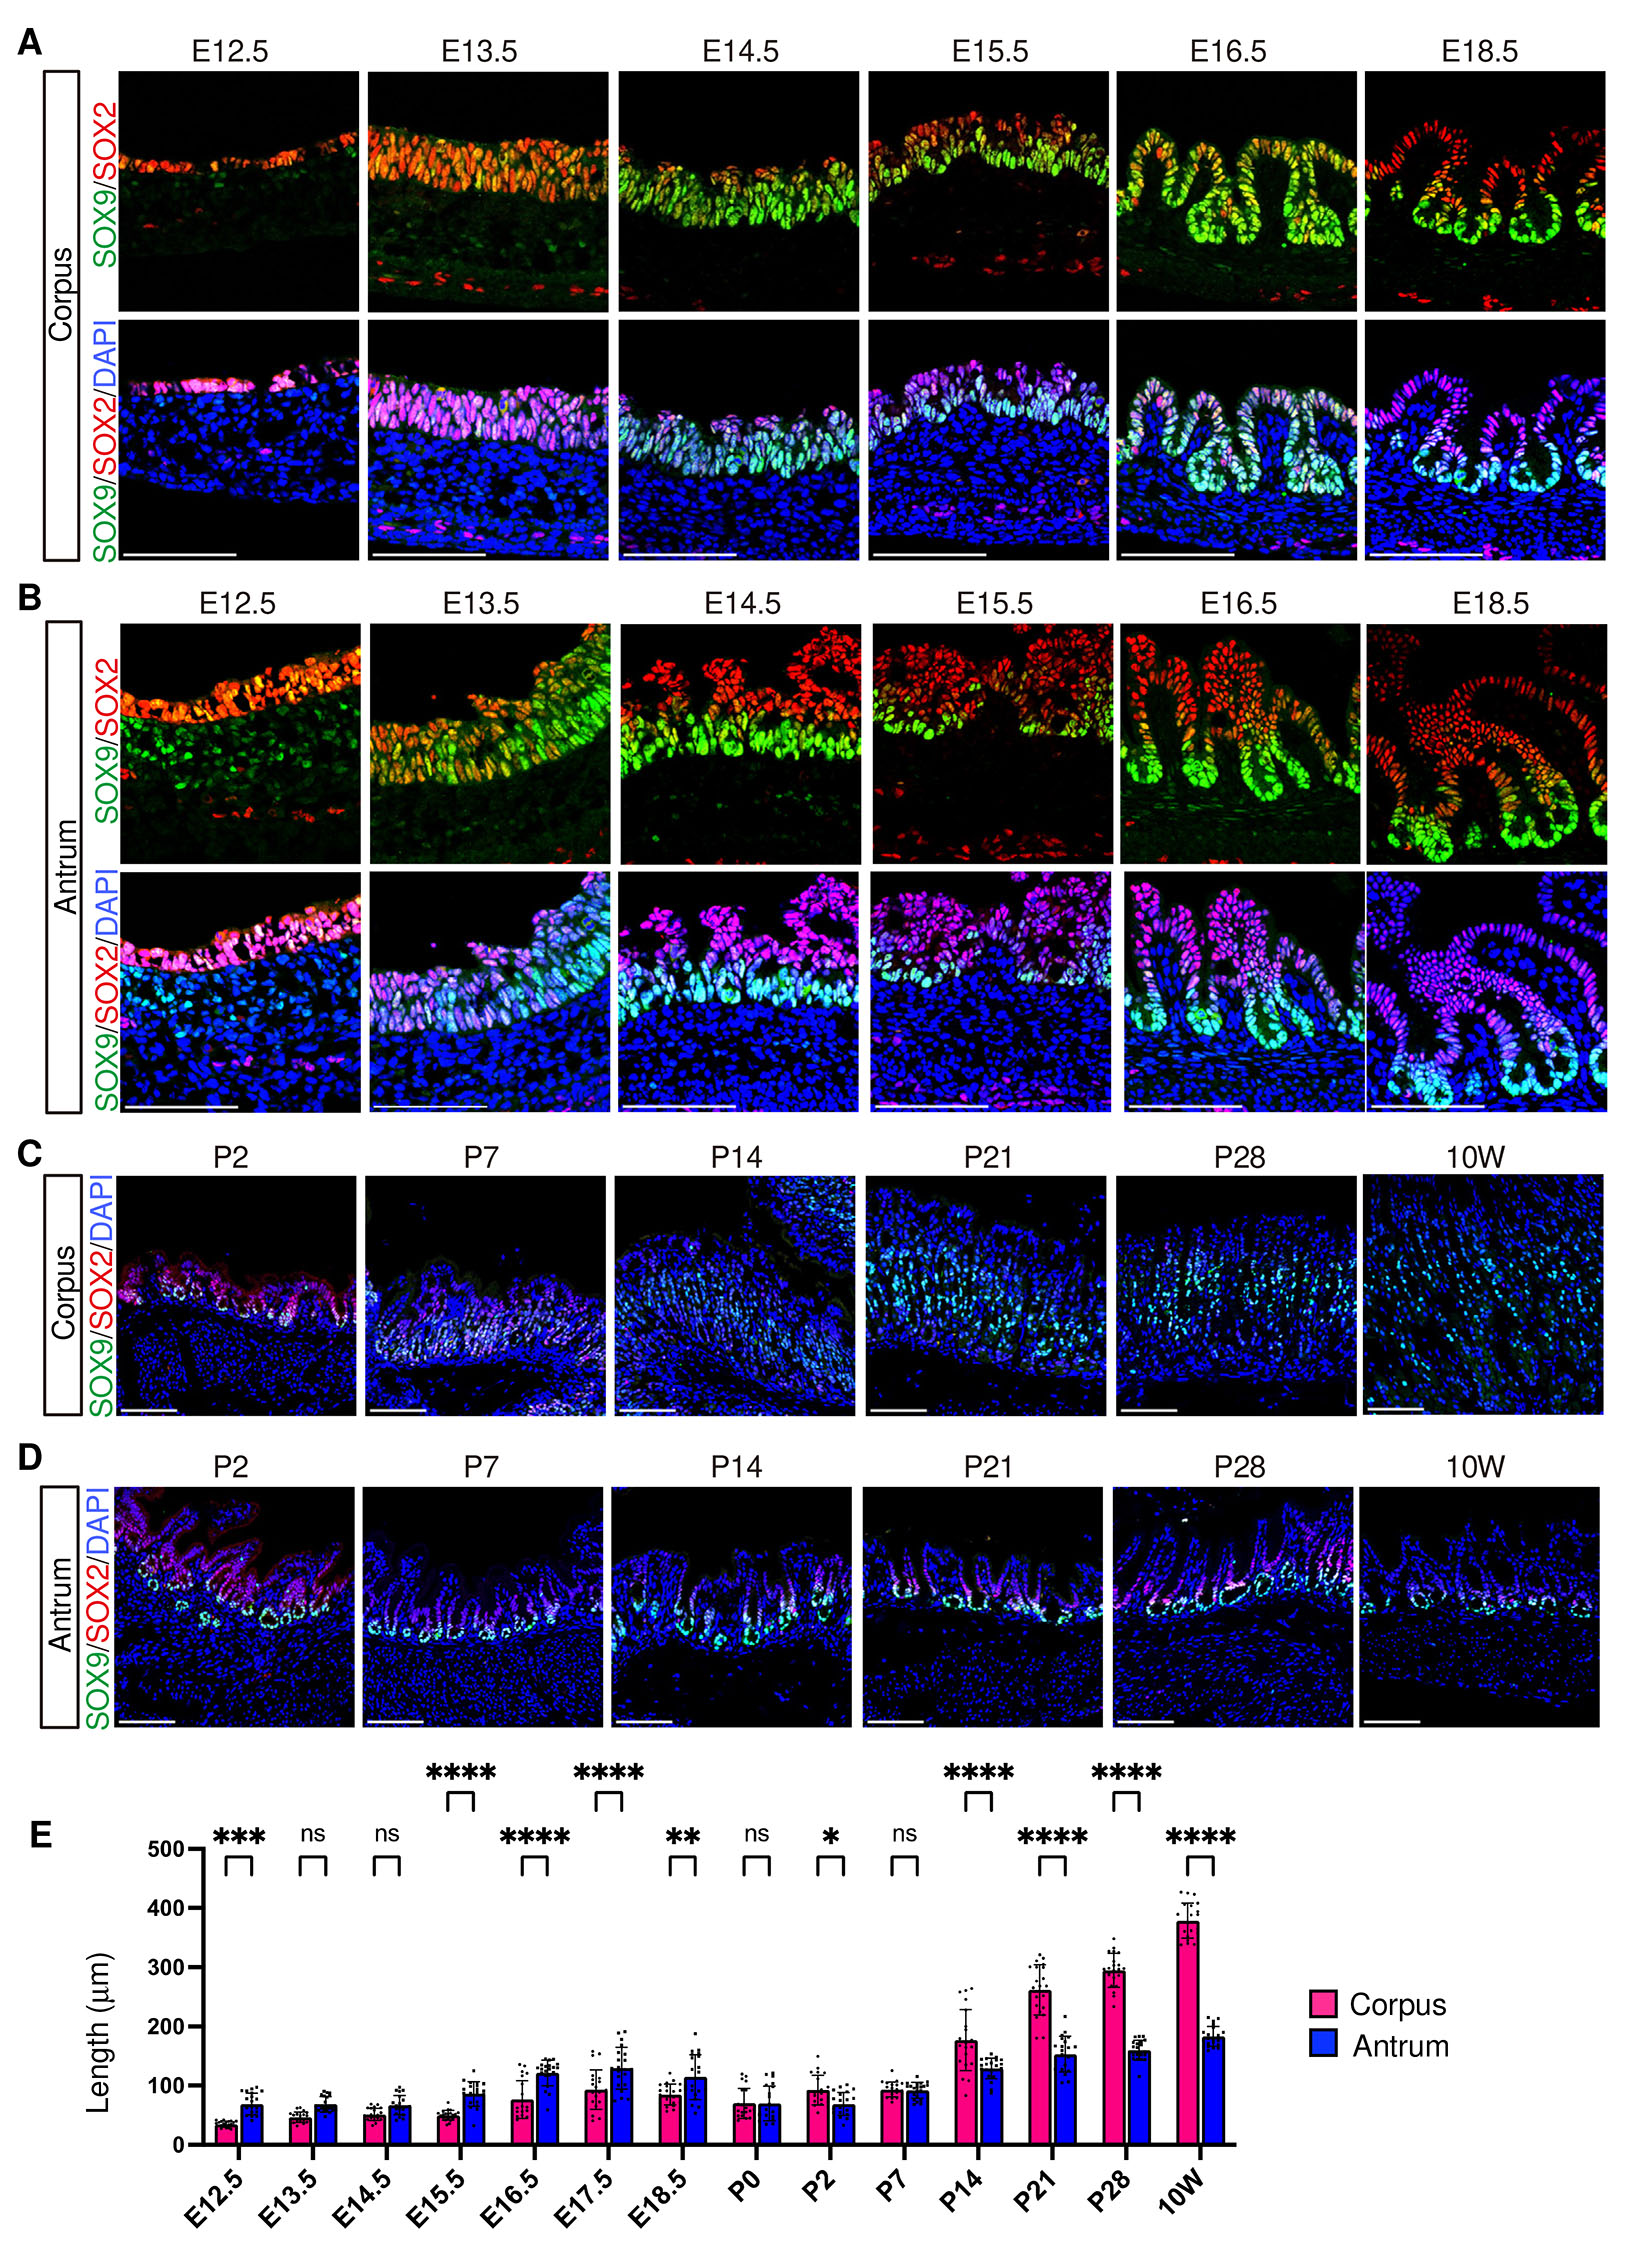
Fig. 1. Spatiotemporal expression of SOX9 and SOX2 in the corpus and antrum.
>(A–D) Representative immunofluorescence images showing SOX9 (green) and SOX2 (red) expression, with nuclei counterstained with DAPI (blue). (A,B) Embryonic expression in the corpus (A) and antrum (B). (C,D) Postnatal expression in the corpus (C) and antrum (D). Images are representative of n = 3 embryos or mice per stage. Scale bars, 100 μm. E, embryonic day; P, postnatal day; W, week. This convention is used throughout for all figures. (E) Comparison of epithelial length between the corpus and the antrum. At early developmental stages before gland formation, epithelial thickness was measured at seven positions per embryo, whereas gland length was measured in seven glands per mouse at later stages (n = 3 embryos or mice per stage). Statistical analysis was performed using two-way ANOVA followed by Šídák’s multiple comparisons test. ns, not significant; *, p < 0.05; **, p< 0.01; ***, p< 0.001; ****, p< 0.0001.
Cytokeratin-7 (CK7), a fetal marker of the human and mouse gastric epithelium (Kirchner et al., 2001; Sankoda et al., 2021), was detectable in the corpus epithelium as early as E12.5, followed by partial reduction at P2 (Fig. 2 and Fig. S2). From P7 onward, CK7 expression was restricted to a small subset of epithelial cells. In the antrum, CK7 was also detected at E12.5; however, unlike in the corpus, CK7 expression persisted in the upper and intermediate regions of the glands until adulthood, while being lost at the gland base from P2 onward.
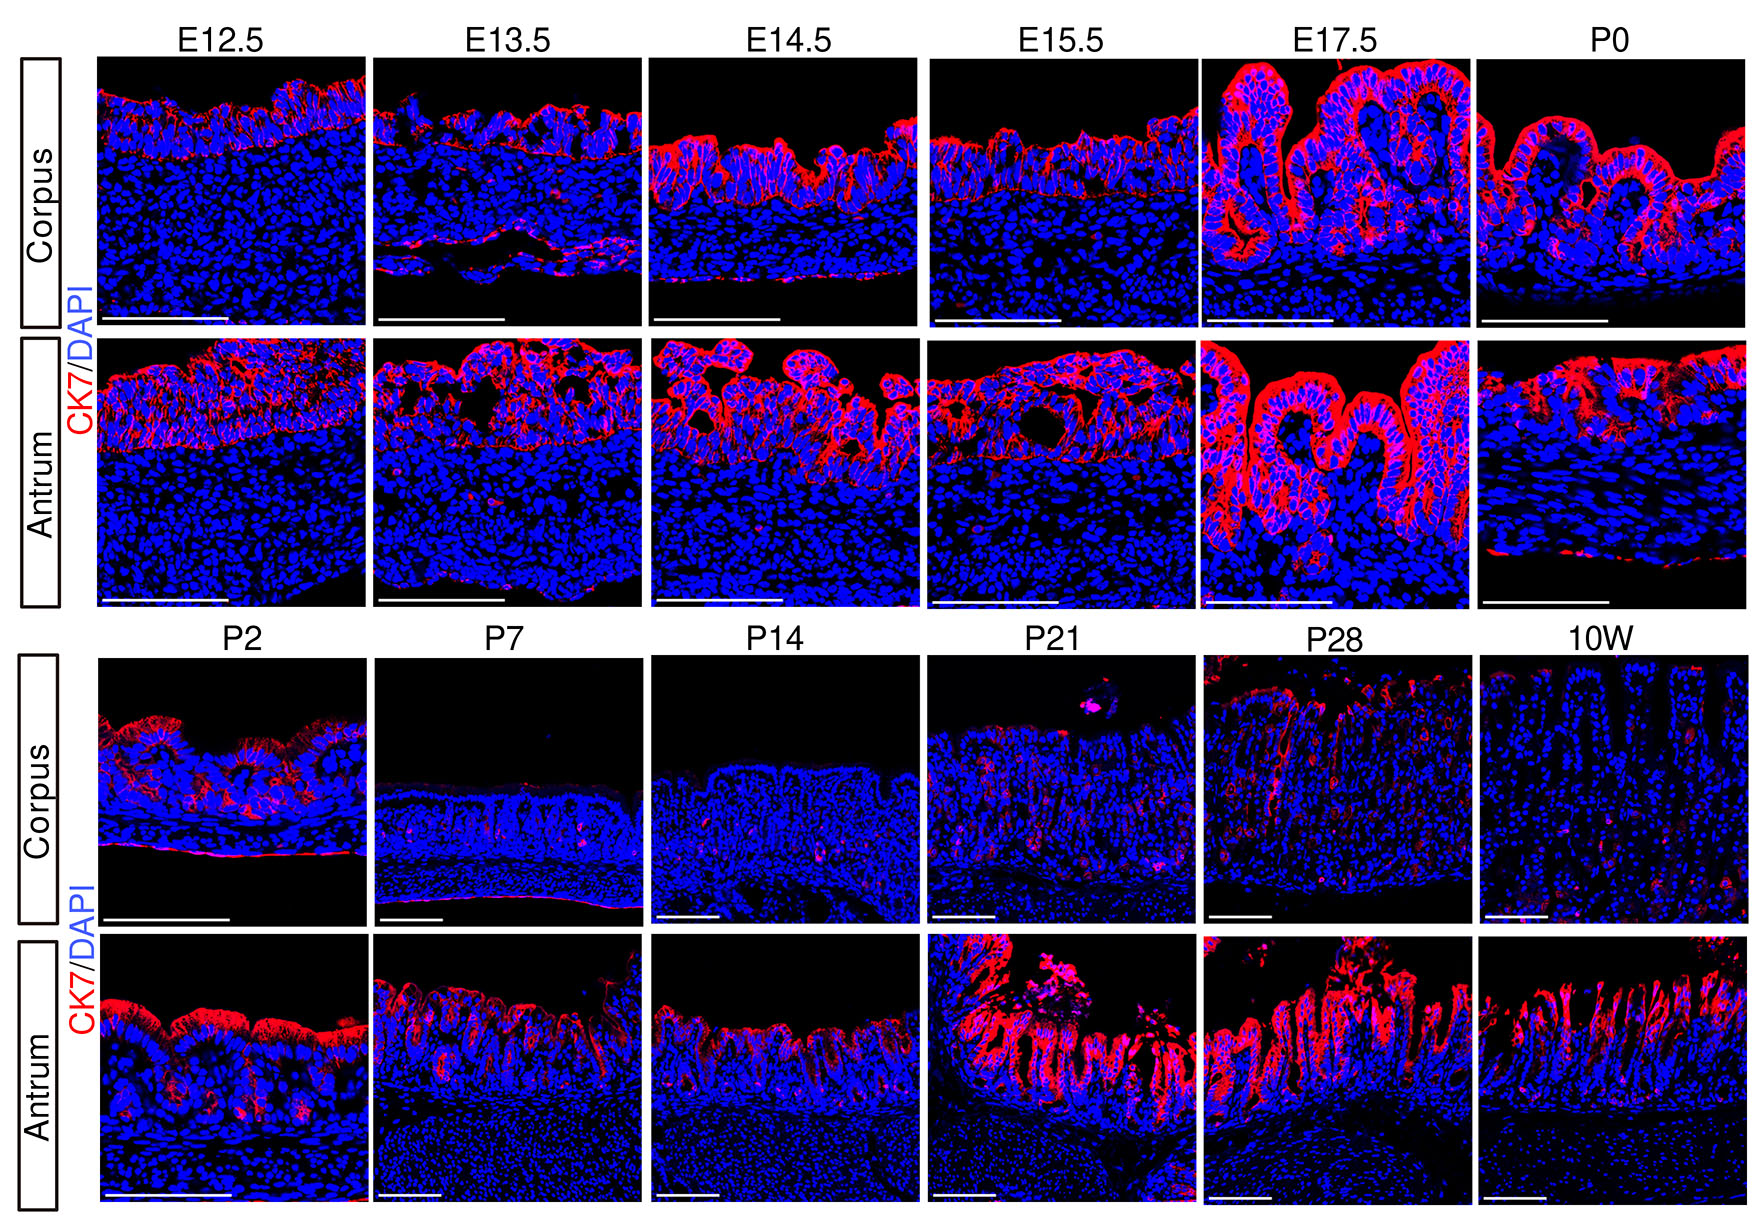
Fig. 2. Spatiotemporal expression of CK7 in the corpus and antrum.
Representative immunofluorescence images showing CK7 (red). Nuclei were counterstained with DAPI (blue). Images are representative of n = 3 embryos or mice per stage. Scale bars, 100 μm.
Collectively, these findings revealed that the fetal-to-adult transition, as reflected by the decline of fetal type markers, occurs between P2–P14 in the corpus. In contrast, the antrum retains the expression of fetal markers, implying the presence of region-specific maturation programs in the developing stomach.
Differentiation and maturation of surface pit cells
Previous proteomics and transcriptomic studies have shown a developmental transition in mucin expression in surface pit cells: an embryonic pit cell-associated mucin MUC5B is expressed from E17.5 to P14, whereas an adult pit cell-associated mucin MUC5AC becomes upregulated from P21 (Li et al., 2018; Wei et al., 2023). Our immunofluorescence analysis showed that MUC5B was expressed in the most superficial epithelial cells of both the corpus and antrum from E16.5 (Fig. 3A and Fig. S3). MUC5B became undetectable by P14 in the antrum and by P21 in the corpus, demonstrating faster maturation of the antrum pit cells. In parallel, GKN2, a mature pit cell marker, emerged at E17.5 in the antrum and at P0 in the corpus, marking the onset of mature pit cell maturation (Fig. 4A and Fig. S4). Thus, both the decline of MUC5B and the onset of GKN2 expression occurred earlier in the antrum glands.
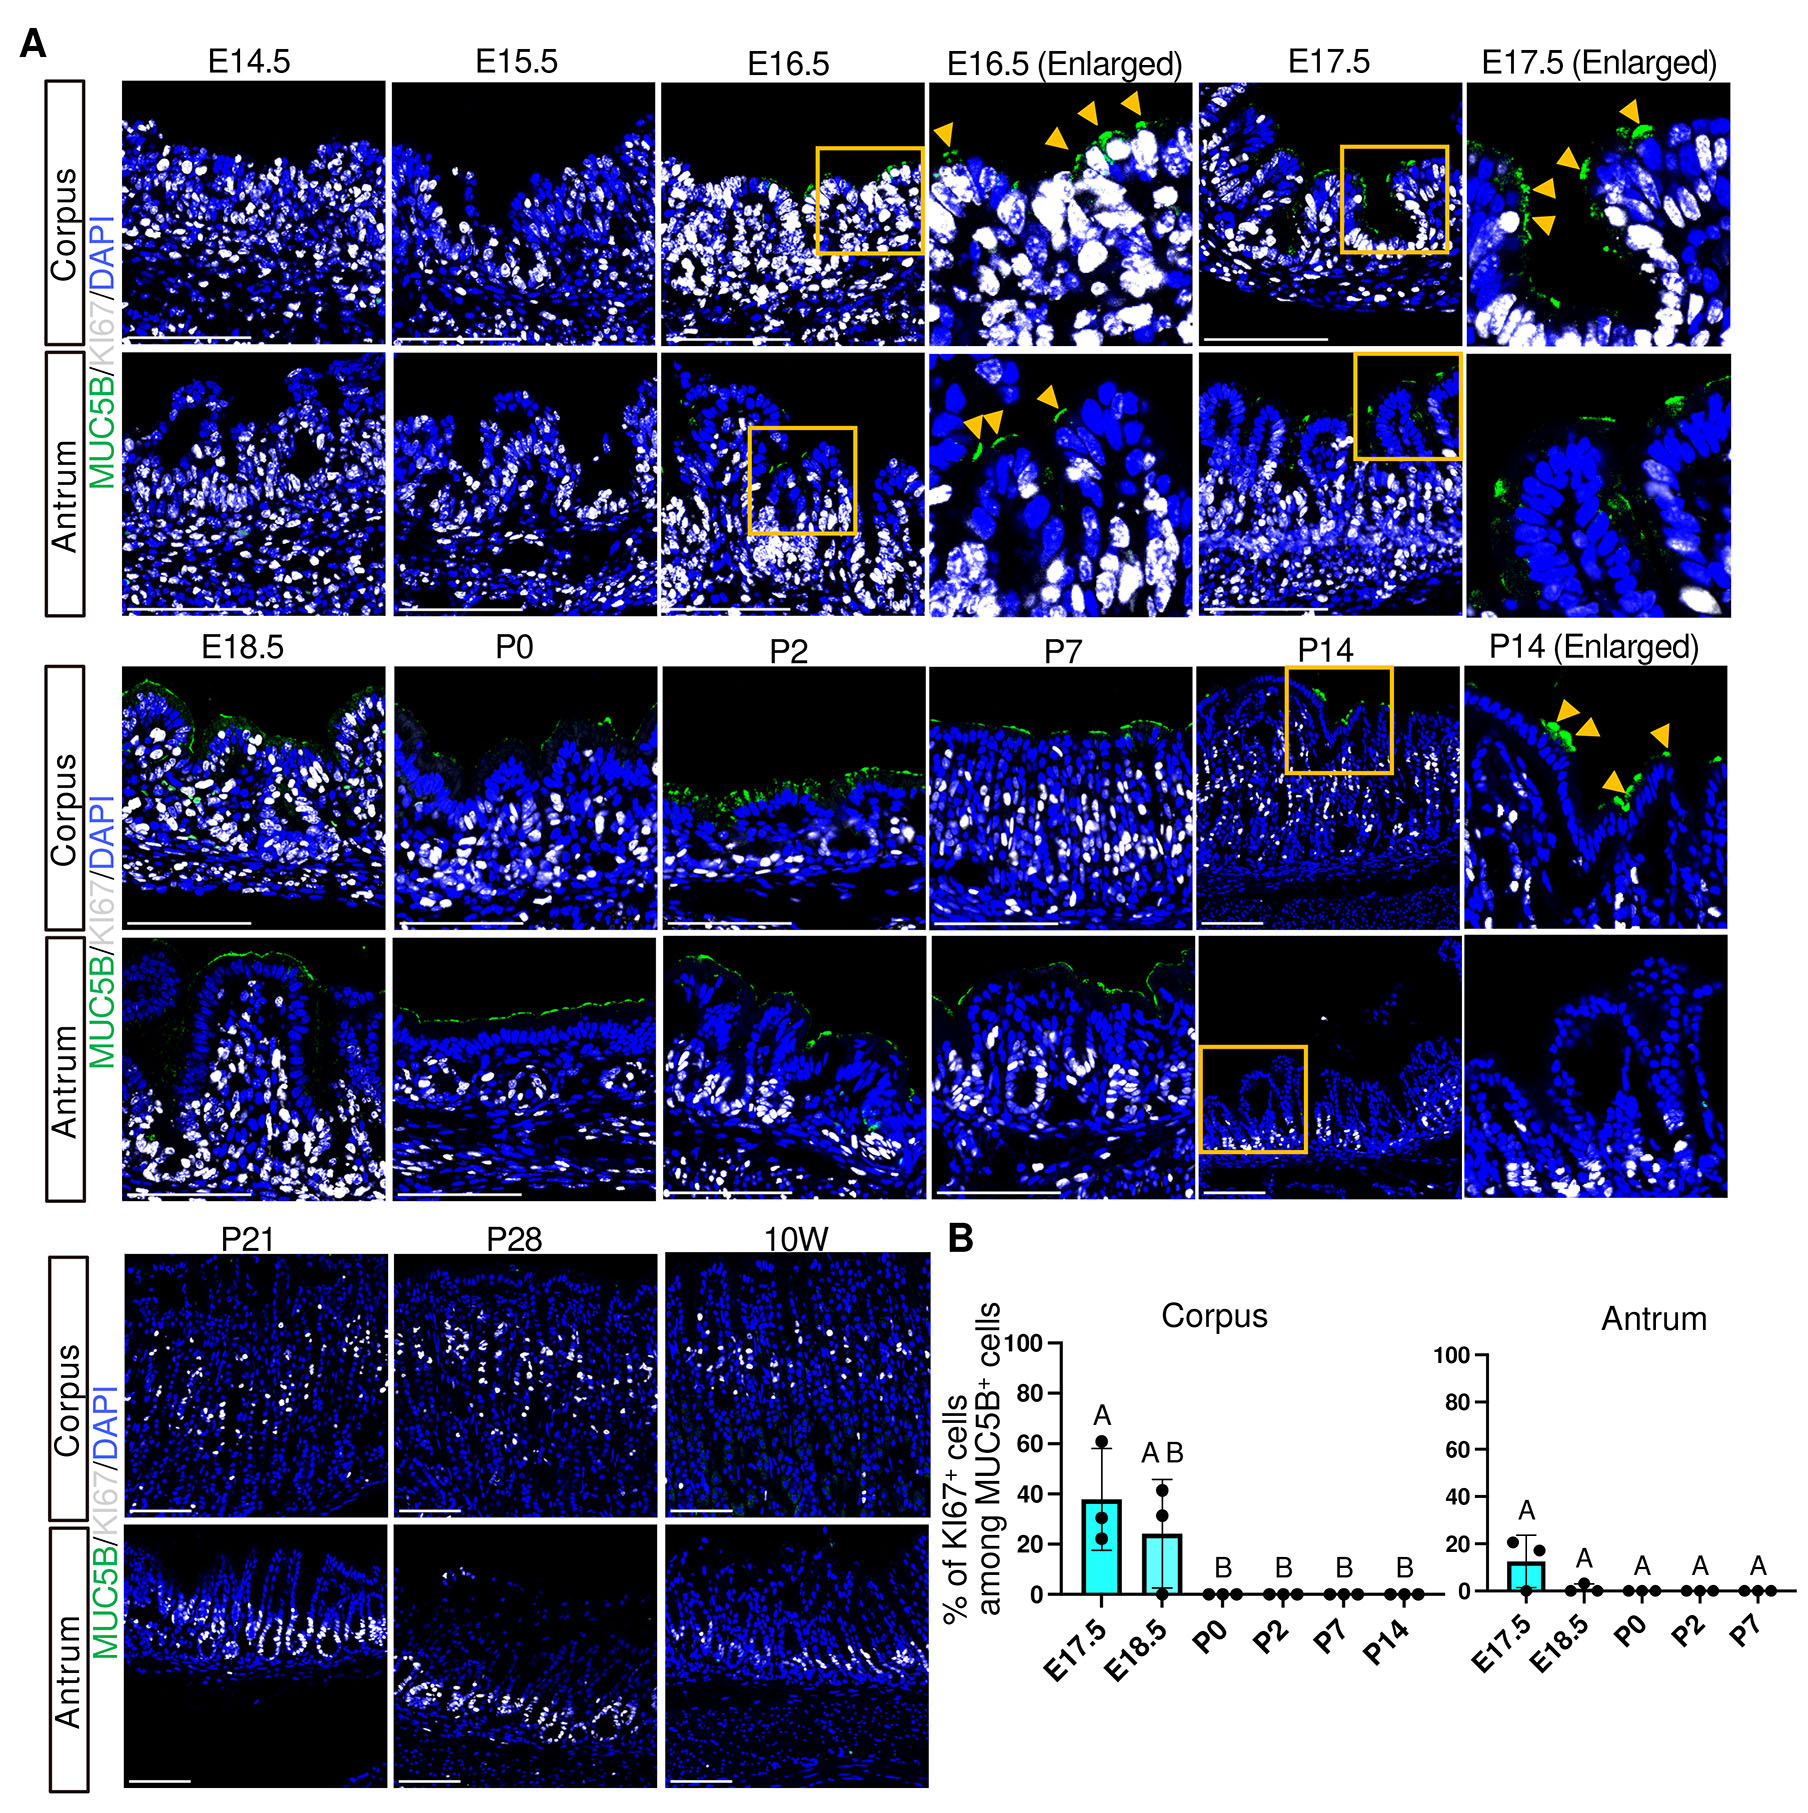
Fig. 3. Spatiotemporal expression of MUC5B and KI67 in the corpus and antrum.
(A) Representative immunofluorescence images showing MUC5B (green) and KI67 (white) expression. Nuclei were counterstained with DAPI (blue). Images are representative of n = 3 embryos or mice per stage. Orange arrowheads indicate MUC5B+ cells. Scale bars, 100 μm. Boxed regions (orange) indicate areas shown as enlarged views in the corresponding panels labeled as “Enlarged”. This convention is used throughout all figures. Brightness and contrast of MUC5B channel were adjusted uniformly across all images for clarity. (B) Percentage of KI67-positive cells among MUC5B-positive cells in the corpus (left) and antrum (right). E16.5 was excluded from quantitative analysis because MUC5B expression was undetectable in one of three embryos, although KI67⁺/MUC5B⁺ cells were detected in MUC5B-positive samples. At stages where MUC5B+ cells were present, but no KI67+/MUC5B+ cells were detected, the proportion was plotted as 0. Each data point represents quantification from a single representative image per mouse (n = 3 mice per stage). Data are presented as mean ± SD. Statistical analysis was performed using one-way ANOVA followed by Tukey’s multiple comparisons test. Groups not sharing the same letter are significantly different (p < 0.05).
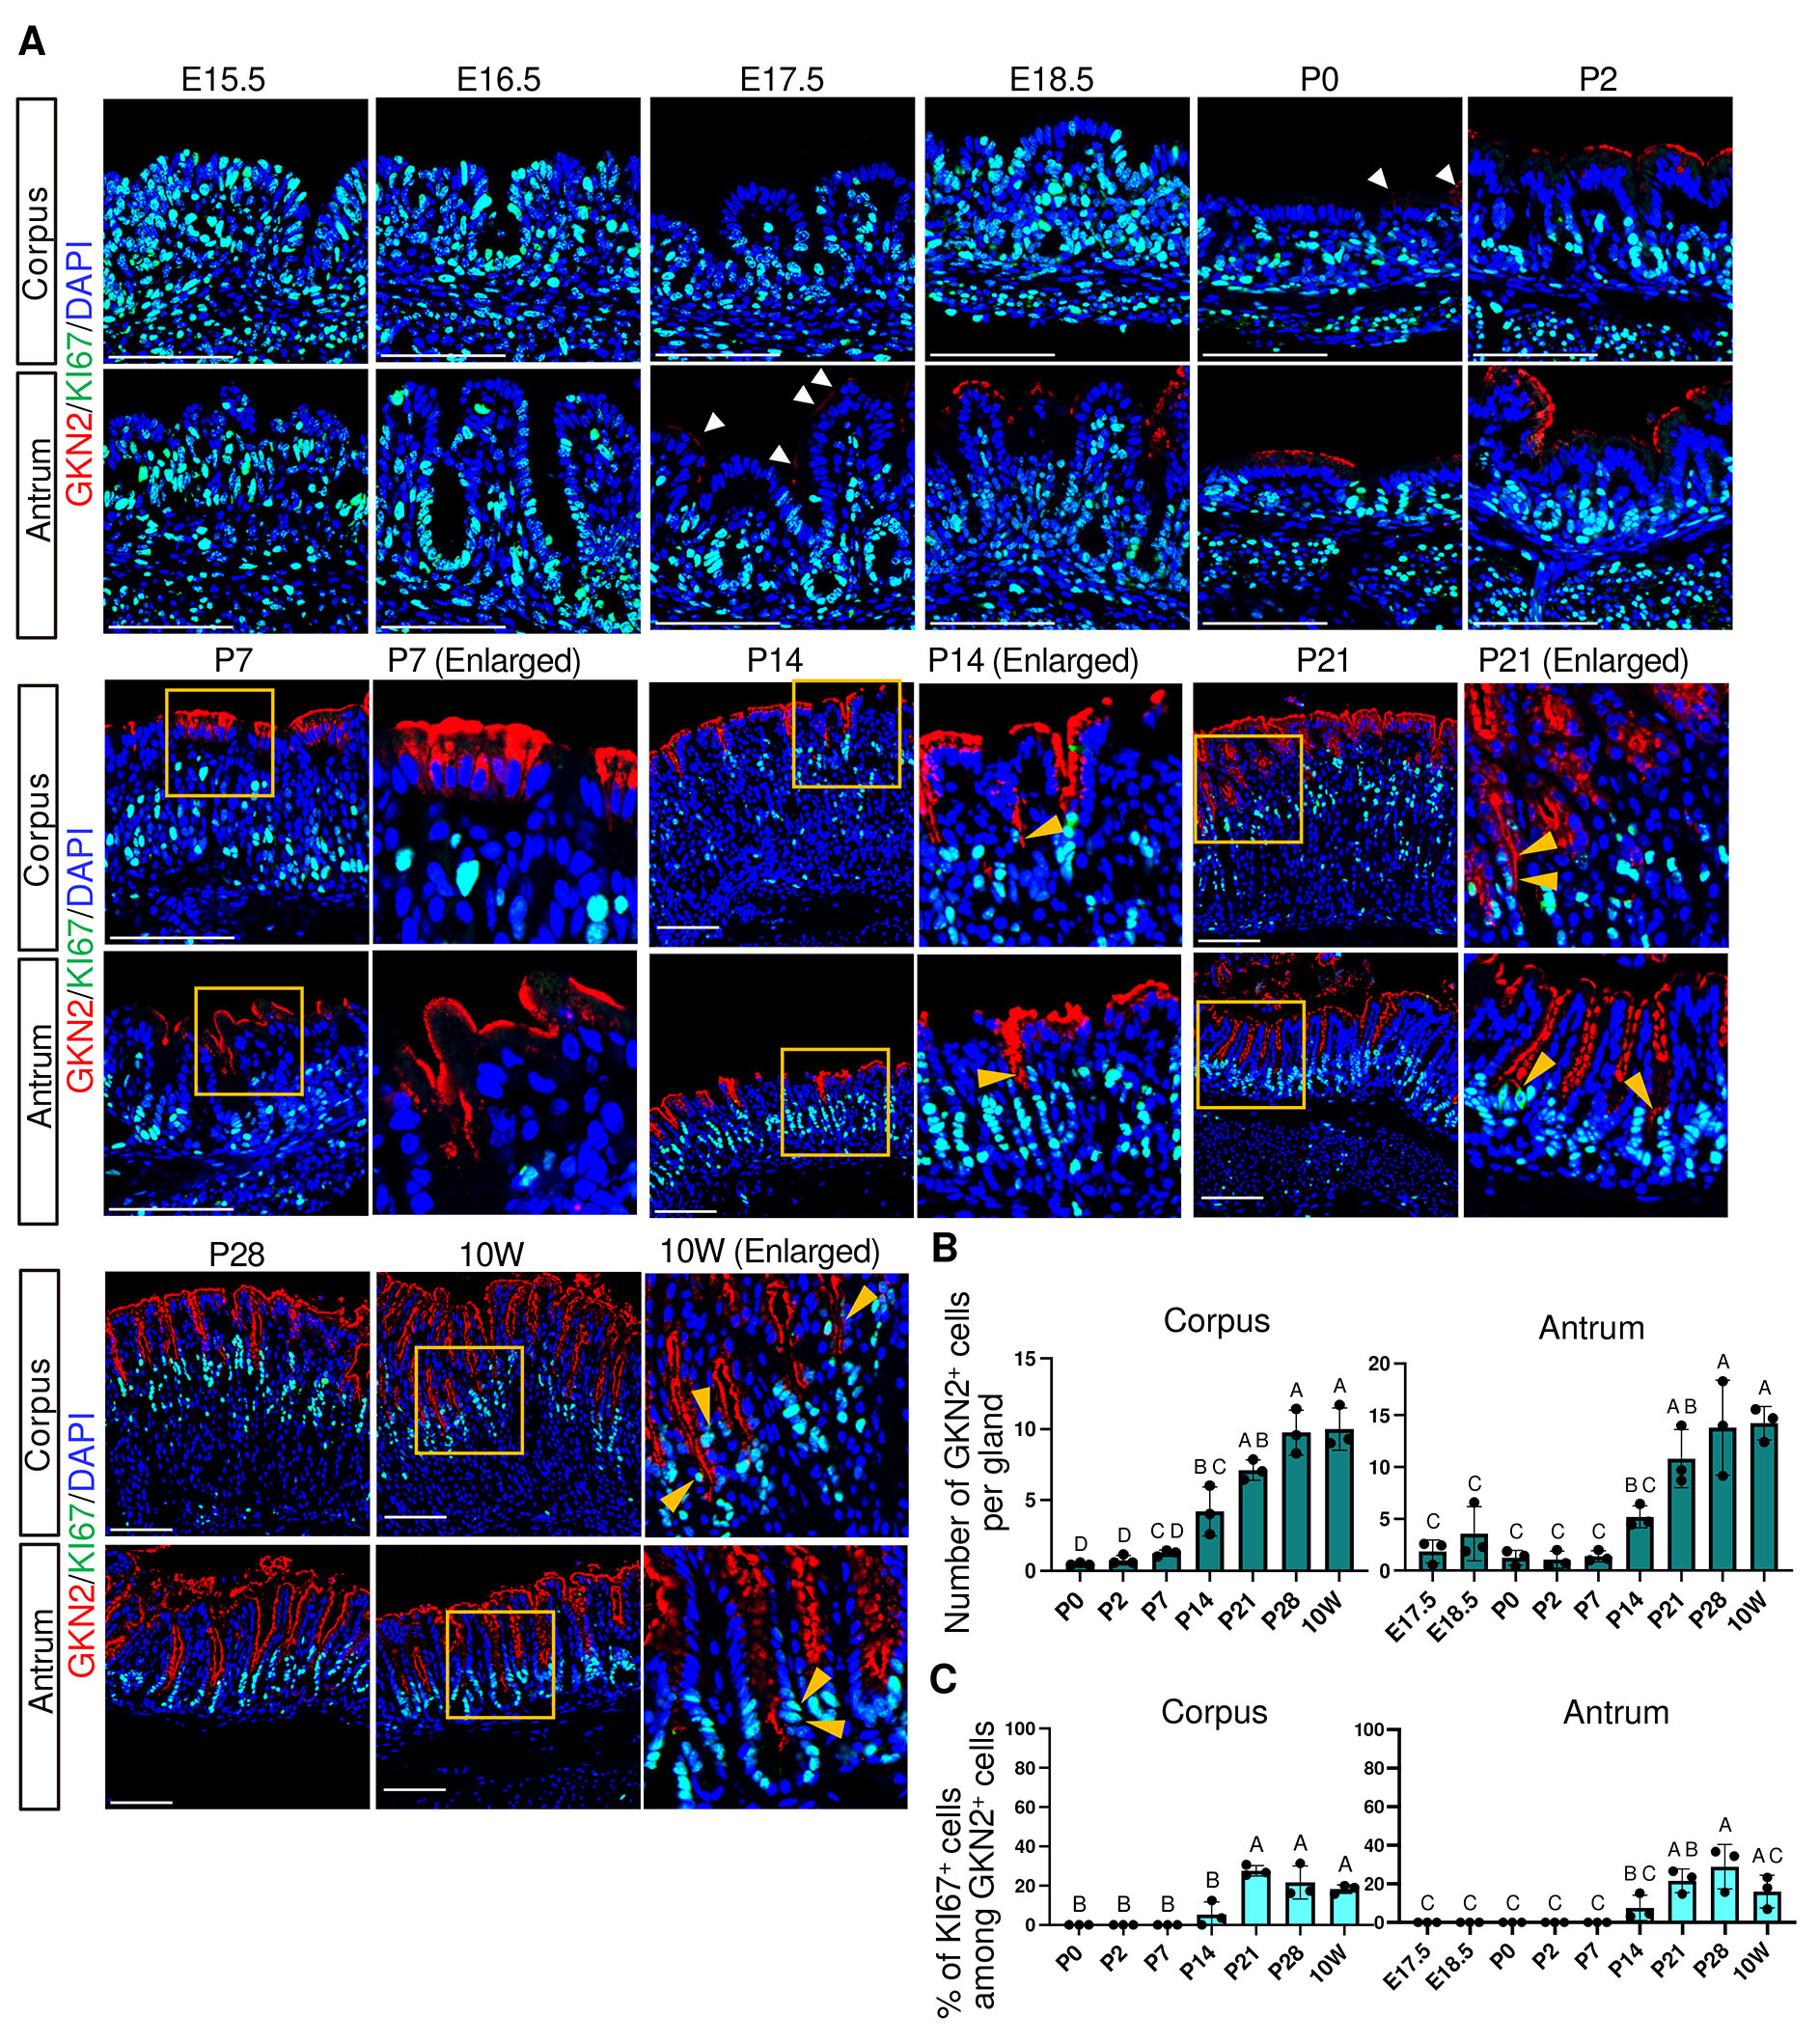
Fig. 4. Spatiotemporal expression of GKN2 and KI67 in the corpus and antrum.
(A) Representative immunofluorescence images showing GKN2 (red) and KI67 (green) expression. Nuclei were counterstained with DAPI (blue). Images are representative of n = 3 embryos or mice per stage. White arrowheads indicate weakly GKN2+ cells at P0 in the corpus and E17.5 in the antrum. Orange arrowheads indicate KI67+/GKN2+ cells. Scale bars: 100 μm. (B) Developmental changes in the number of GKN2+ cells per gland. (C) Percentage of KI67-positive cells among GKN2-positive cells. GKN2+ cells were present but no KI67+/GKN2 + cells were detected; the proportion was thus plotted as 0. For (B) and (C), each data point represents the mean of seven glands per mouse (n = 3 mice per stage). Data are presented as mean ± SD. Statistical analysis was performed using one-way ANOVA followed by Tukey’s multiple comparisons test. Groups not sharing the same letter are significantly different (p < 0.05).
In the adult stomach, rapid pit cell turnover is associated with the presence of proliferating pit cell progenitors at the isthmus region, which exhibit nuclear KI67 expression together with apical GKN2 expression (Fig. 4A, 10W, orange arrowheads). Therefore, we next examined the emergence and dynamics of proliferating pit cell populations during development. KI67⁺/MUC5B⁺ cells were observed at E16.5–E18.5 and were absent at later stages, indicating that proliferating fetal-type pit cells are restricted to very late fetal phase (Fig. 3 A,B). Notably, because MUC5B expression at E16.5 was variable and undetectable in one of three embryos, this stage was excluded from quantitative analysis. In contrast, KI67⁺/GKN2⁺ cells were not detected between P0 and P7 but first appeared by P14 at the isthmus in both the corpus and antrum (Fig. 4 A,C), coinciding with an increase in the number of GKN2+ cells per gland (Fig. 4B). These findings suggest that adult-type pit cell renewal activity is established by P14.
These findings indicate that surface pit cells undergo an embryonic-to-adult transition characterized by a transient presence of fetal-type proliferating progenitor cells during late fetal stages, followed by a postnatal period lacking proliferative pit cell progenitors, and subsequently the emergence of proliferating GKN2+ progenitors at the isthmus by P14 (Fig. 3, 4, 10).
Differentiation and maturation of parietal cells
Upon food intake, the adult stomach secretes gastric acid from parietal cells, resulting in a low intragastric pH. In contrast, the neonatal stomach exhibits a relatively high pH, which gradually decreases during postnatal development (Walthall et al., 2005; Yoneda et al., 2001). In our analysis, ATP4B, a parietal-specific proton pump subunit, was weakly detectable at E15.5 and became clearly visible by E16.5 (Fig. 5A and Fig. S5). The number of ATP4B⁺ cells increased markedly at P14 (Fig. 5C), indicating substantial expansion of the parietal cell population postnatally.
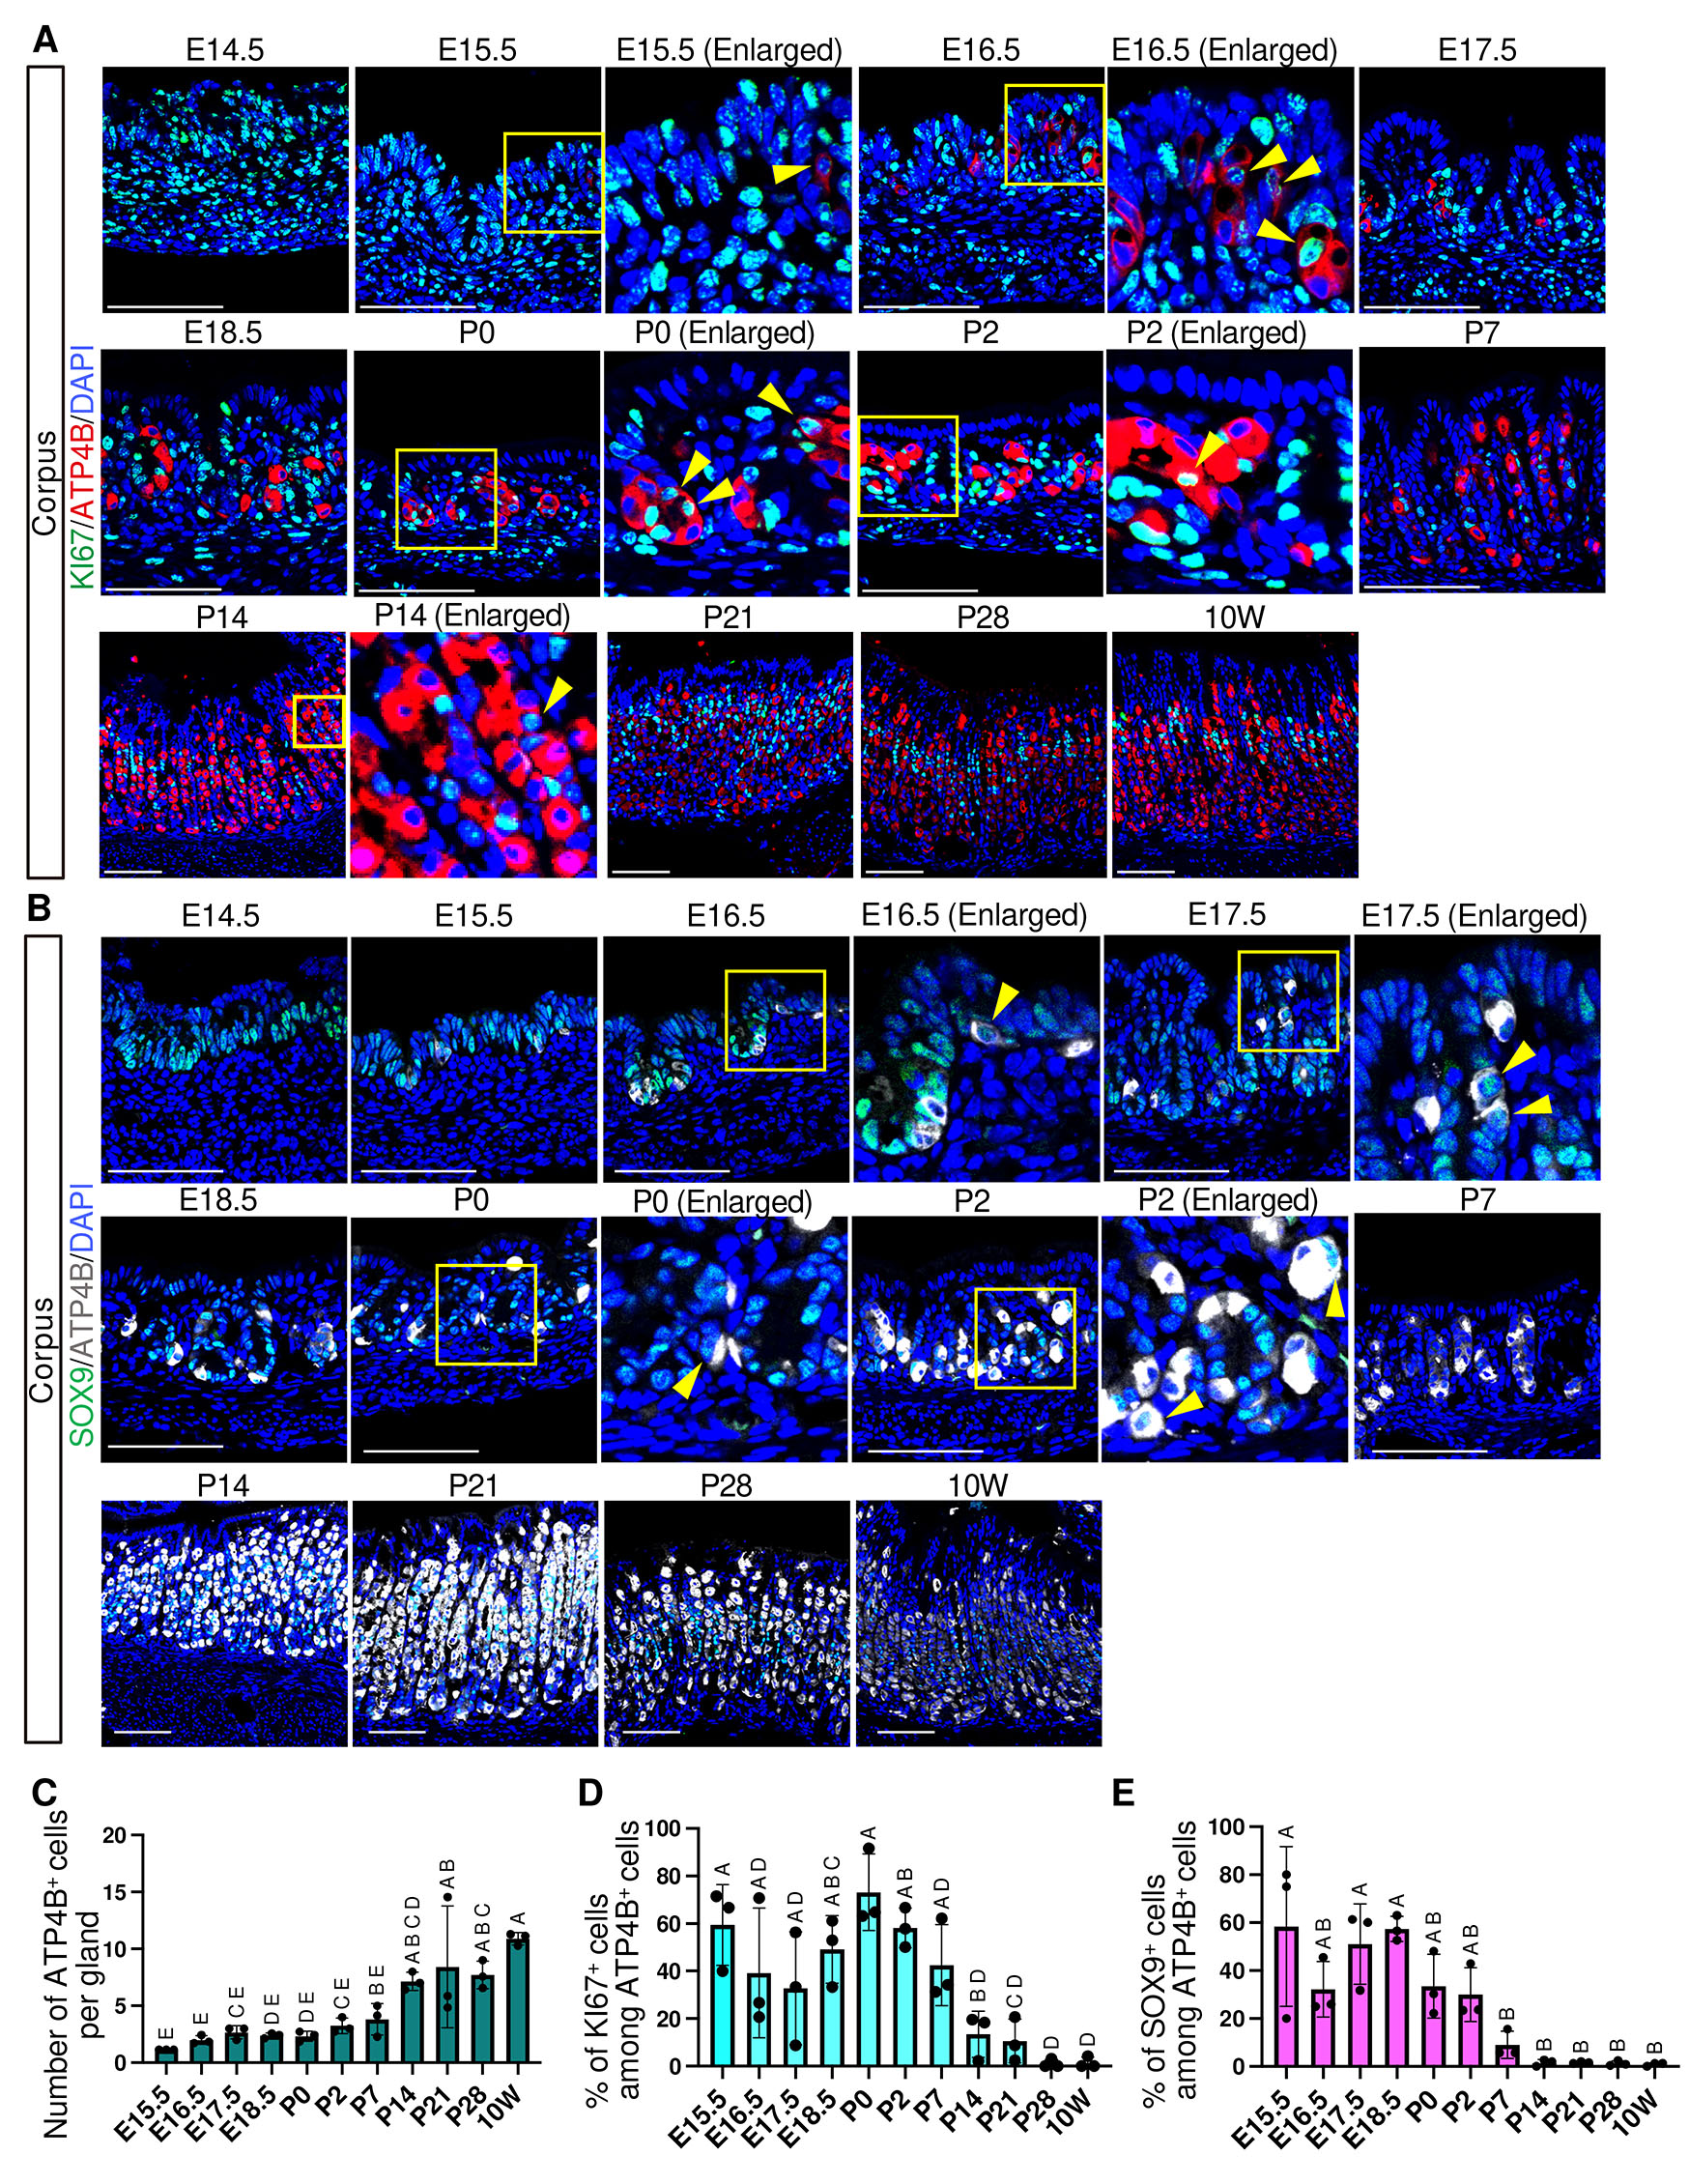
Fig. 5. Spatiotemporal expression of ATP4B, KI67, and SOX9 in the corpus.
(A) Representative immunofluorescence images showing ATP4B (red) and KI67 (green) expression. (B) Representative immunofluorescence images showing ATP4B (white) and SOX9 (green) expression. For (A) and (B), nuclei were counterstained with DAPI (blue). Images are representative of n = 3 embryos or mice per stage. Scale bars: 100 μm. Yellow arrowheads indicate KI67+/ATP4B+ cells (A) and SOX9+/ATP4B+ cells (B). (C) Developmental changes in the number of ATP4B+ cells per gland. Each data point represents the mean of seven glands per mouse (n = 3 mice per stage). (D) Percentage of KI67-positive cells among ATP4B-positive cells. Each data point represents the mean of seven glands per mouse (n = 3 mice per stage). (E) Percentage of SOX9-positive cells among ATP4B-positive cells. Each data point represents quantification from a single representative image per mouse (n = 3 mice per stage). For (C–E), data are presented as mean ± SD. Statistical analysis was performed using one-way ANOVA followed by Tukey’s multiple comparisons test. Groups not sharing the same letter are significantly different (p < 0.05).
In adult gastric tissue, parietal cells exhibit a slow turnover rate of approximately 54 days (Karam, 2010), and accordingly, KI67⁺/ATP4B⁺ cells were rarely observed. In contrast, our analysis revealed that around 60% of ATP4B⁺ cells express KI67 at E15.5, indicating that they are in a proliferative and immature state at this stage (Fig. 5D). The proportion of KI67⁺/ATP4B⁺ cells declined significantly at P14 (Fig. 5D), showing the maturation toward an adult-type homeostatic state. Because SOX9 is broadly expressed in embryonic gastric progenitors (Fig. 1A), we next examined the proportion of SOX9+/ATP4B+ cells as an additional indicator of parietal cell immaturity. More than half of ATP4B⁺ cells coexpressed SOX9 at E15.5 (Fig. 5 B,E), and this proportion declined sharply by P7, preceding the reduction in KI67⁺/ATP4B⁺ cells.
Adult parietal cells have been proposed to arise from multiple progenitor populations, including pre-pit cells, pre-neck cells, and isthmus stem cells (Karam and Leblond, 1993; Kataoka and Sakano, 1984). To examine one aspect of this multilineage contribution, we focused on pre-pit derived parietal cells, identified by coexpression of ATP4B and the pit cell marker GKN2 (Fig. 6A and Fig. S6). These double-positive cells first appeared at P14 and persisted through 10 weeks (Fig. 6 A,B), indicating that pre-pit–derived parietal cell differentiation is initiated by P14.
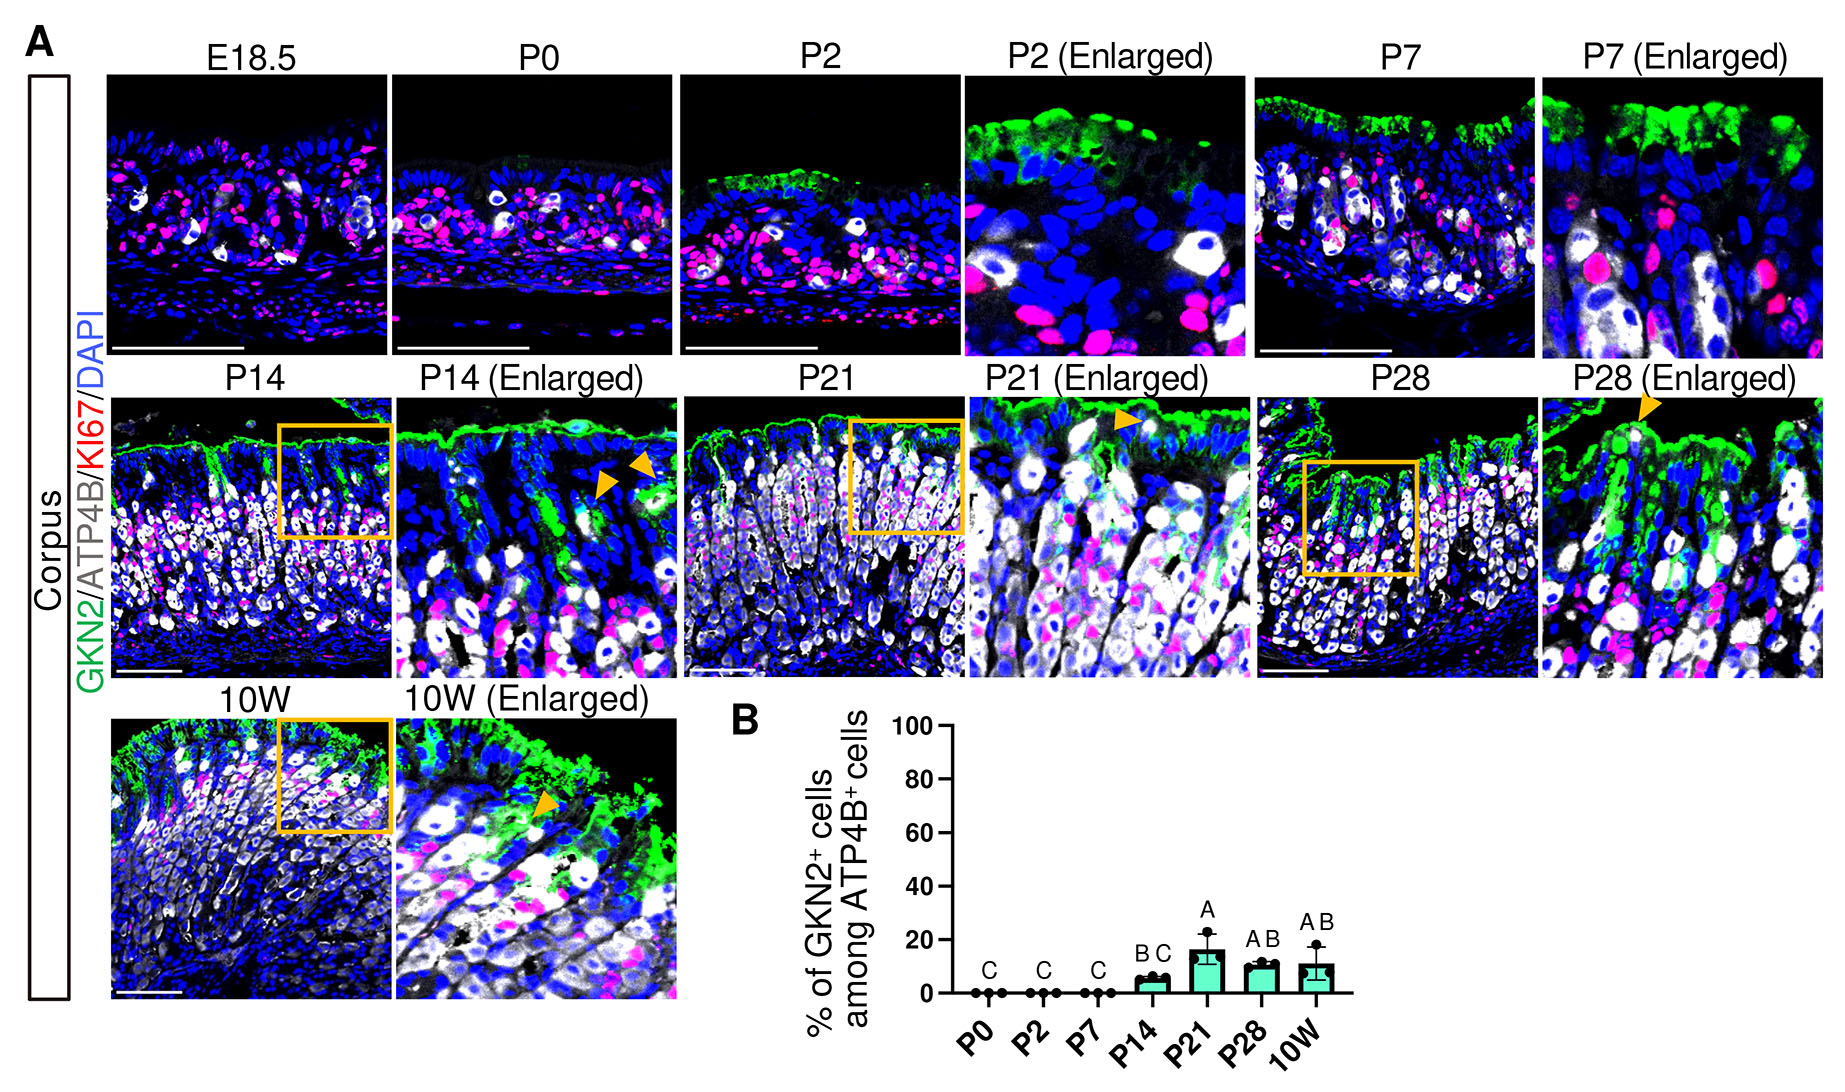
Fig. 6. Spatiotemporal expression of ATP4B, GKN2, and KI67 in the corpus.
(A) Representative immunofluorescence images showing ATP4B (white), GKN2 (green) and KI67 (red) expression. Nuclei were counterstained with DAPI (blue). Images are representative of n = 3 embryos or mice per stage. Orange arrowheads indicate ATP4B+/GKN2+ cells. Scale bars: 100 μm. (B) Percentage of GKN2-positive cells among ATP4B-positive cells. Each data point represents quantification from a single representative image per mouse (n = 3 mice per stage). When ATP4B+ cells were present but no ATP4B+/GKN2 + cells were detected, the proportion was plotted as 0. Data are presented as mean ± SD. Statistical analysis was performed using one-way ANOVA followed by Tukey’s multiple comparisons test. Groups not sharing the same letter are significantly different (p < 0.05).
Taken together, these findings indicate that parietal cell differentiation is initiated prenatally with the emergence of ATP4B+ cells, followed by a robust proliferative phase dominated by KI67⁺/ATP4B⁺ cells through early postnatal stages (Fig. 10). This phase is subsequently followed by a marked decline in the proportion of KI67⁺/ATP4B⁺ by P14, coinciding with the onset of multilineage contribution to the parietal cell population, as exemplified by the emergence of pre-pit–derived cells.
Differentiation and maturation of chief cells
In mice, chief cells secrete gastric intrinsic factor (GIF), which is required for vitamin B12 absorption (Alpers and Russell-Jones, 2013; Shao et al., 2000), as well as pepsinogen C (PGC), the predominant pepsinogen in the adult stomach. Our immunofluorescence analysis showed that GIF expression was first detected at the base of corpus glands at E17.5 (Fig. 7A and Fig. S7), and the number of GIF+ cells significantly increased at P14 (Fig. 7C). At E17.5, approximately 50% of GIF⁺ cells coexpressed KI67, which express GIF at lower levels, suggesting that a substantial fraction of GIF-expressing cells were in a proliferative and immature state (Fig. 7D). The proportion of KI67⁺/GIF+ cells declined significantly at P21 (Fig. 7D), suggesting the postnatal maturation of the chief cell lineage. In addition, more than 80% of GIF+ cells coexpressed SOX9 at E17.5, further supporting their immature status, and this SOX9+/GIF+ population was markedly reduced by P21 (Fig. 7B,E).
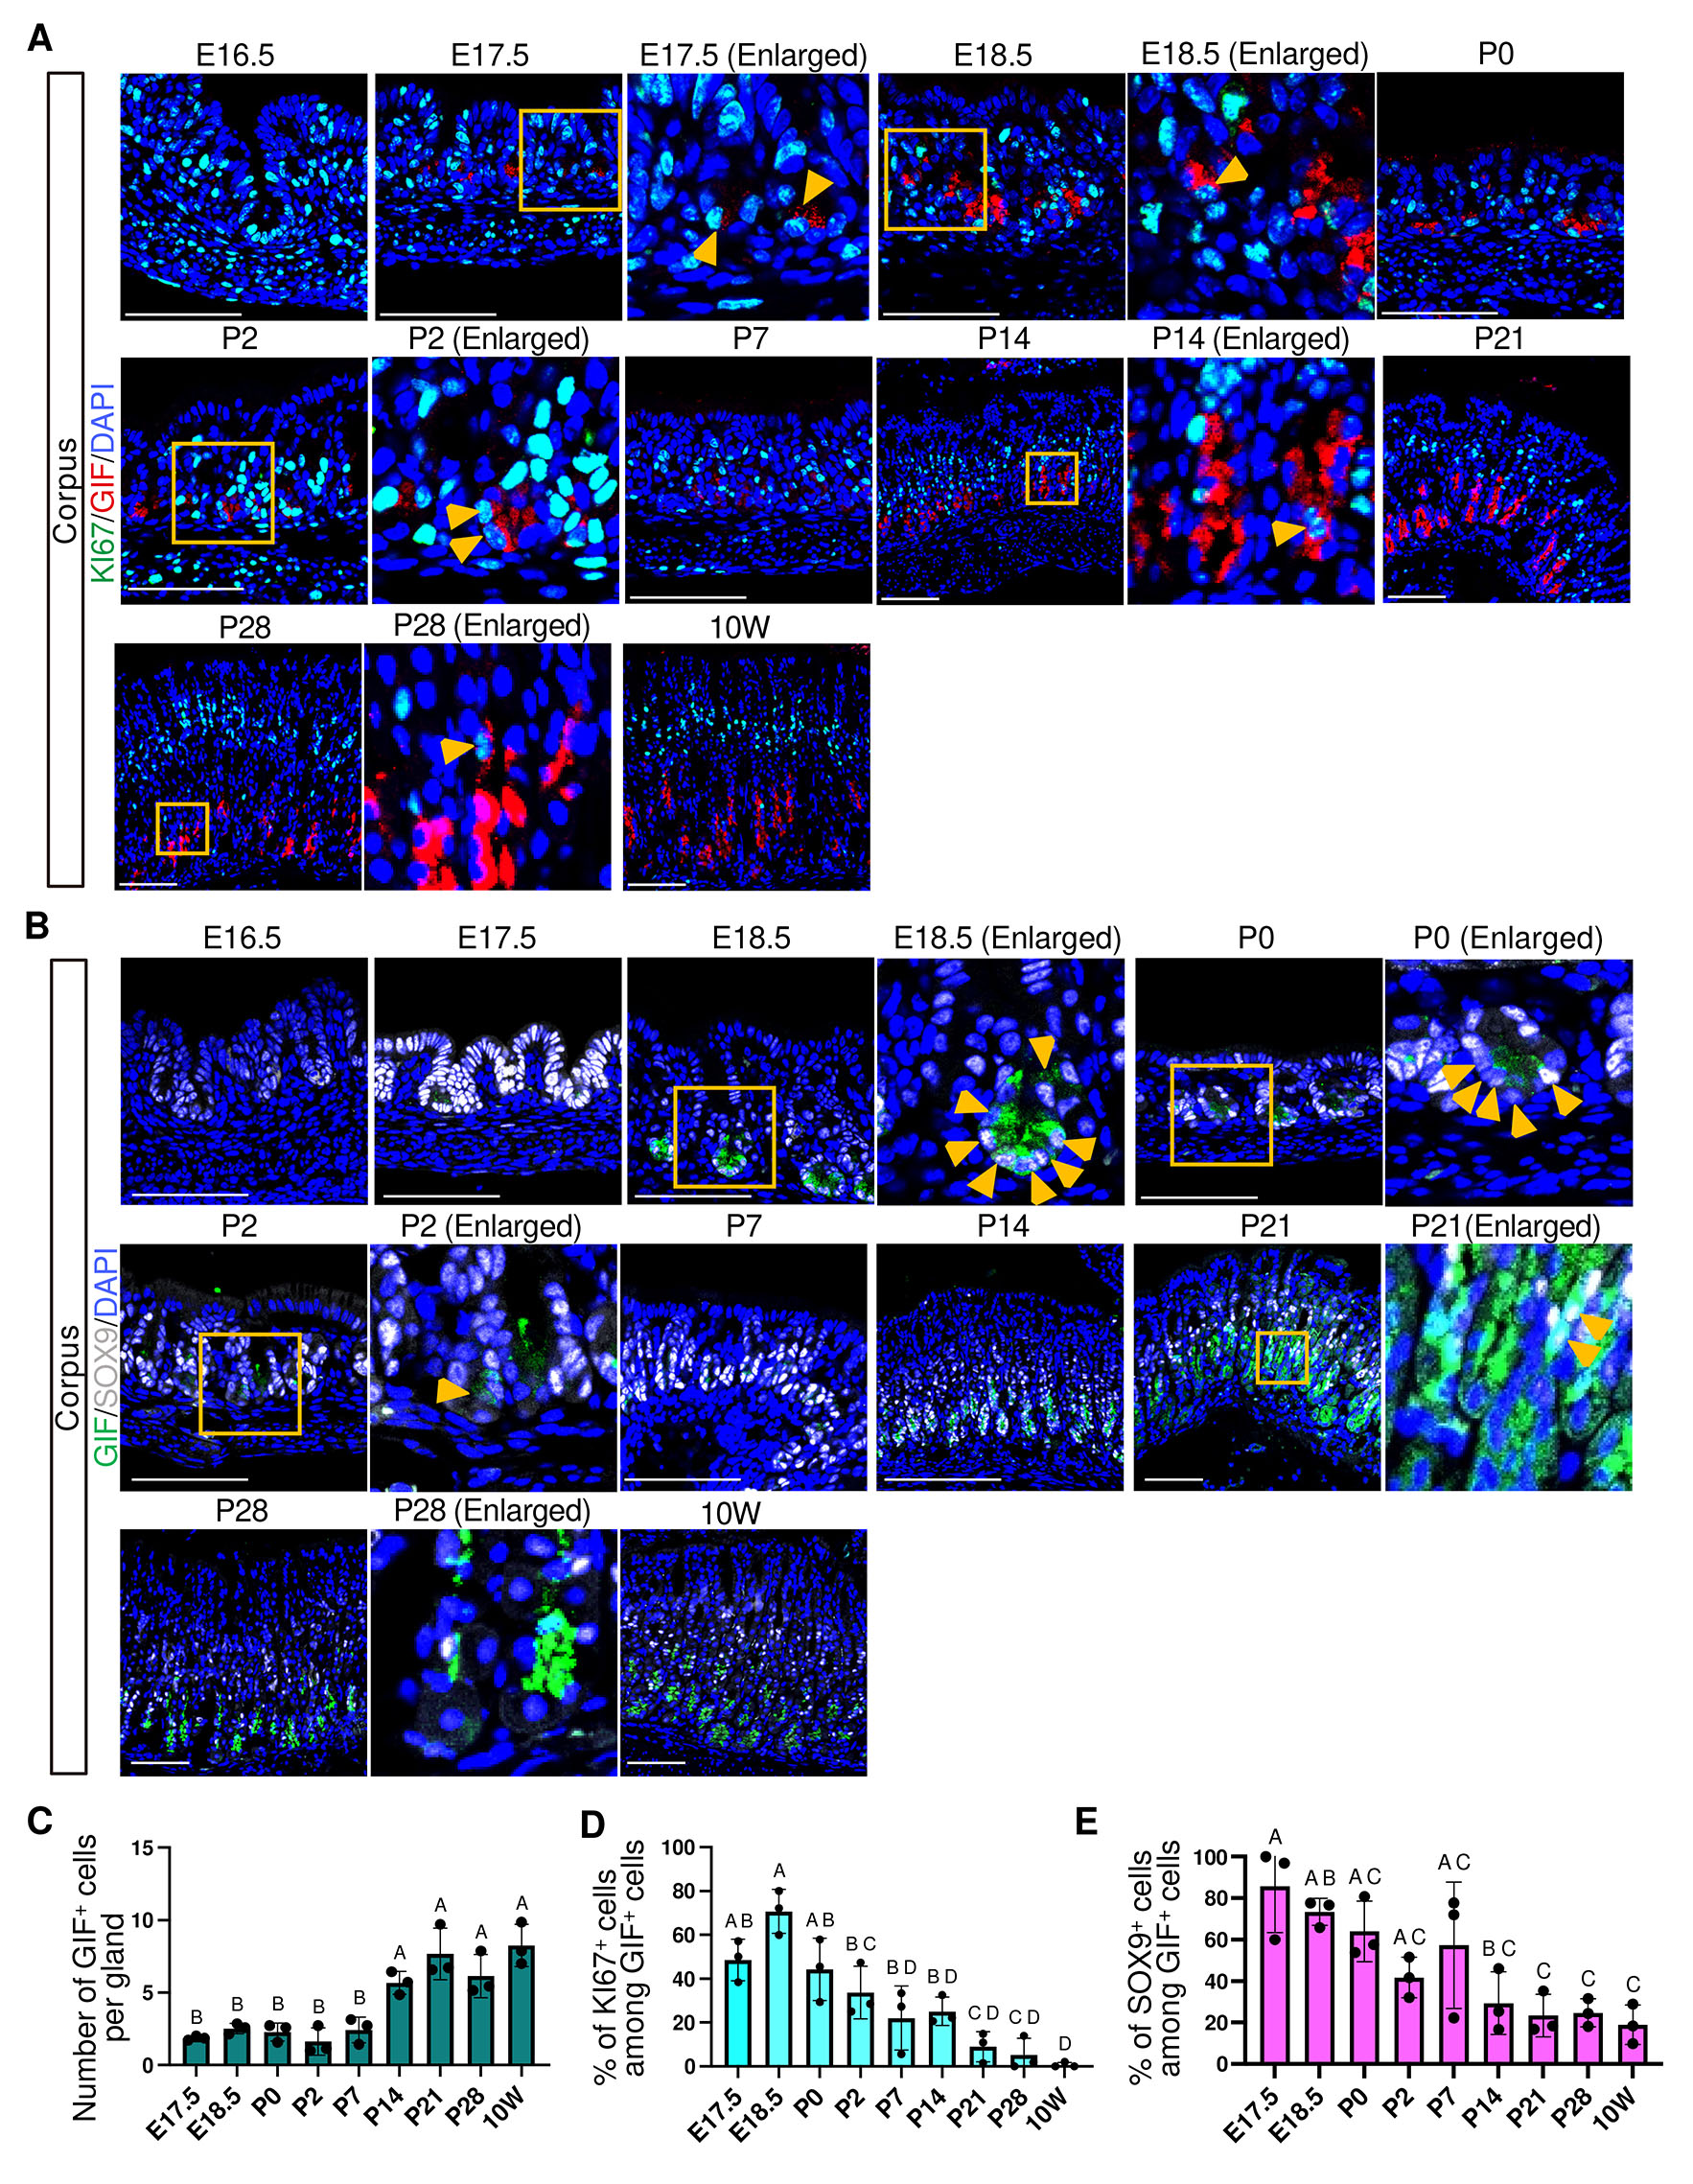
Fig. 7. Spatiotemporal expression of GIF, KI67 and SOX9 in the corpus.
(A) Representative immunofluorescence images showing GIF (red) and KI67 (green) expression. (B) Representative immunofluorescence images showing GIF (green) and SOX9 (white) expression. For (A) and (B), nuclei were counterstained with DAPI (blue). Images are representative of n = 3 embryos or mice per stage. Scale bars: 100 μm. Orange arrowheads indicate KI67+/GIF+ cells (A) and SOX9+/GIF+ cells (B). (C) Developmental changes in the number of GIF+ cells per gland. Each data point represents the mean of seven glands per mouse (n = 3 mice per stage). (D) Percentage of KI67-positive cells among GIF-positive cells. Each data point represents the mean of seven glands per mouse (n = 3 mice per stage). (E) Percentage of SOX9-positive cells among GIF-positive cells. Each data point represents quantification from a single representative image per mouse (n = 3 mice per stage). For (C–E), Statistical analysis was performed using one-way ANOVA followed by Tukey’s multiple comparisons test. Data are presented as mean ± SD. Groups not sharing the same letter are significantly different (p < 0.05).
PGC expression was first detected at the gland base from E16.5 and persisted only limited number of PGC+ cells until P0 (Fig. 8A and Fig. S8). PGC expression became transiently undetectable at P2 and P7, but reappeared by P14. By P21, PGC expression extended from the neck region to the gland base, a pattern similar to that observed in adult corpus glands (Fig. 8A), and this spatial change coincided with a significant increase in the number of PGC⁺ cells (Fig. 8B). At E16.5, approximately 70% of PGC+ cells are KI67+, and this proportion declined significantly by P28 (Fig. 8C).
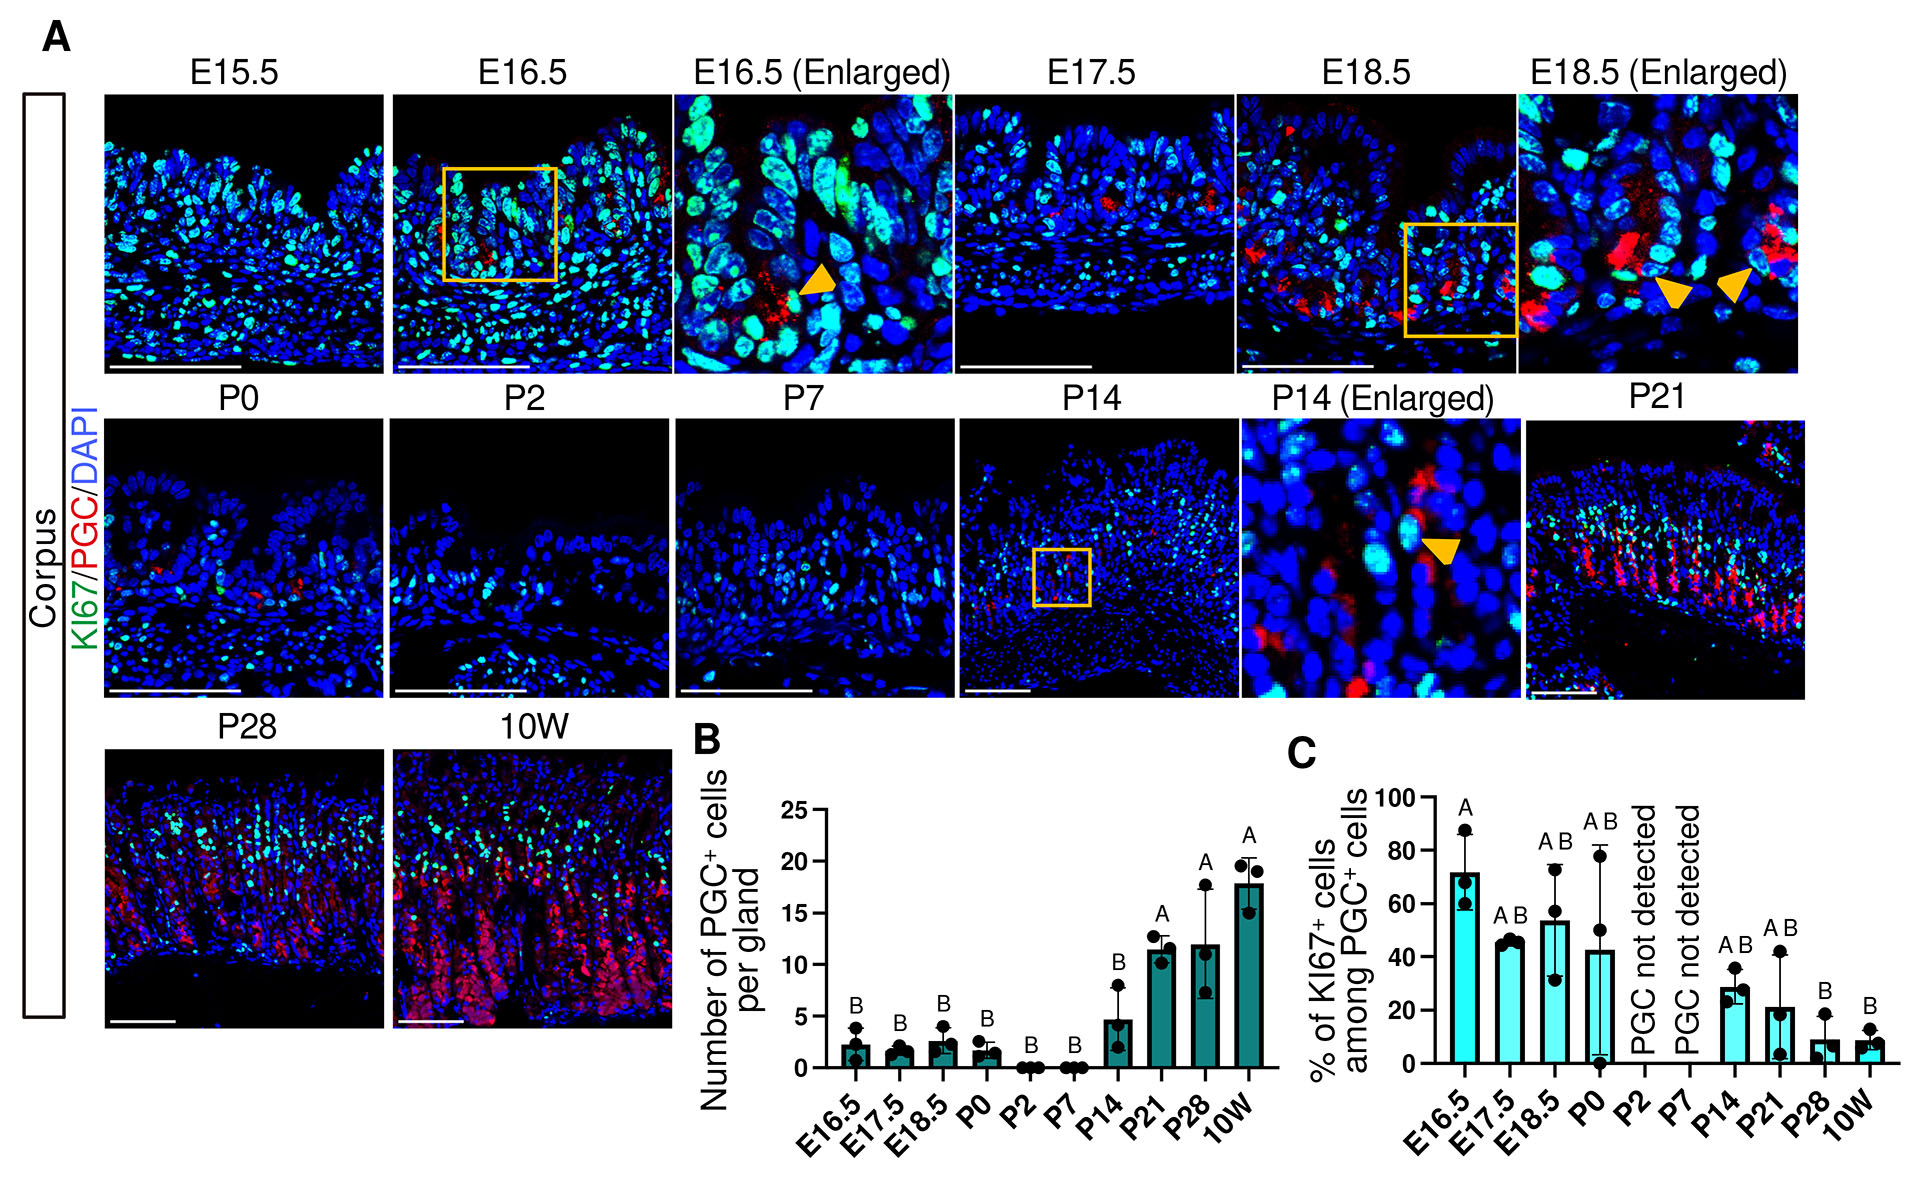
Fig. 8. Spatiotemporal expression of PGC and KI67 in the corpus.
(A) Representative immunofluorescence images showing PGC (red) and KI67 (green) expression. Nuclei were counterstained with DAPI (blue). Images are representative of n = 3 embryos or mice per stage. Scale bars: 100 μm. Orange arrowheads indicate KI67+/PGC+ cells. (B) Developmental changes in the number of PGC+ cells per gland. At P2 and P7, PGC+ cells were not observed and values were plotted as 0. (C) Percentage of KI67-positive cells among PGC-positive cells. P2 and P7 were not plotted because PGC-positive cells were not detected (indicated as “PGC not detected” in the graph). For (B, C), each data point represents the mean of seven glands per mouse (n = 3 mice per stage). Data are presented as mean ± SD. Statistical analysis was performed using one-way ANOVA followed by Tukey’s multiple comparisons test. Groups not sharing the same letter are significantly different (p < 0.05).
These findings indicate that chief cell differentiation is initiated prenatally by E16.5, followed by a distinct early postnatal phase characterized by transient loss of PGC expression, and subsequently by a postnatal expansion associated with proliferative immature cells after P7, ultimately culminating in an adult-type homeostatic state with reduced proliferative activity (Fig. 10).
Differentiation of endocrine cells
The gastric epithelium contains five major endocrine cell types that secrete gastrin, somatostatin, ghrelin, histamine, and serotonin. Among these, gastrin-secreting G cells, which stimulate gastric acid secretion, are observed in the antrum. In our analysis, gastrin (GAST) expression was first detected at E14.5, preceding the appearance of other functional epithelial cell markers (Fig. 9A and Fig. 10). Previous studies have suggested that gastrin promotes epithelial proliferation and parietal cell differentiation (Jain and Samuelson, 2006; Koh et al., 1997); therefore, its very early onset of expression may reflect a broader developmental role for gastrin during embryogenesis. Other endocrine lineage makers showed later onset; somatostatin (SST), which suppresses gastric acid secretion, was detected in the corpus by E17.5 (Fig. 9B and Fig. S9A), while ghrelin (GHRL), an appetite-regulating hormone, was detected by E16.5 (Fig. 9C and Fig. S9B). The number of GAST⁺, SST⁺, and GHRL⁺ endocrine cells per gland increased significantly by P14 (Fig. 9 D–F).
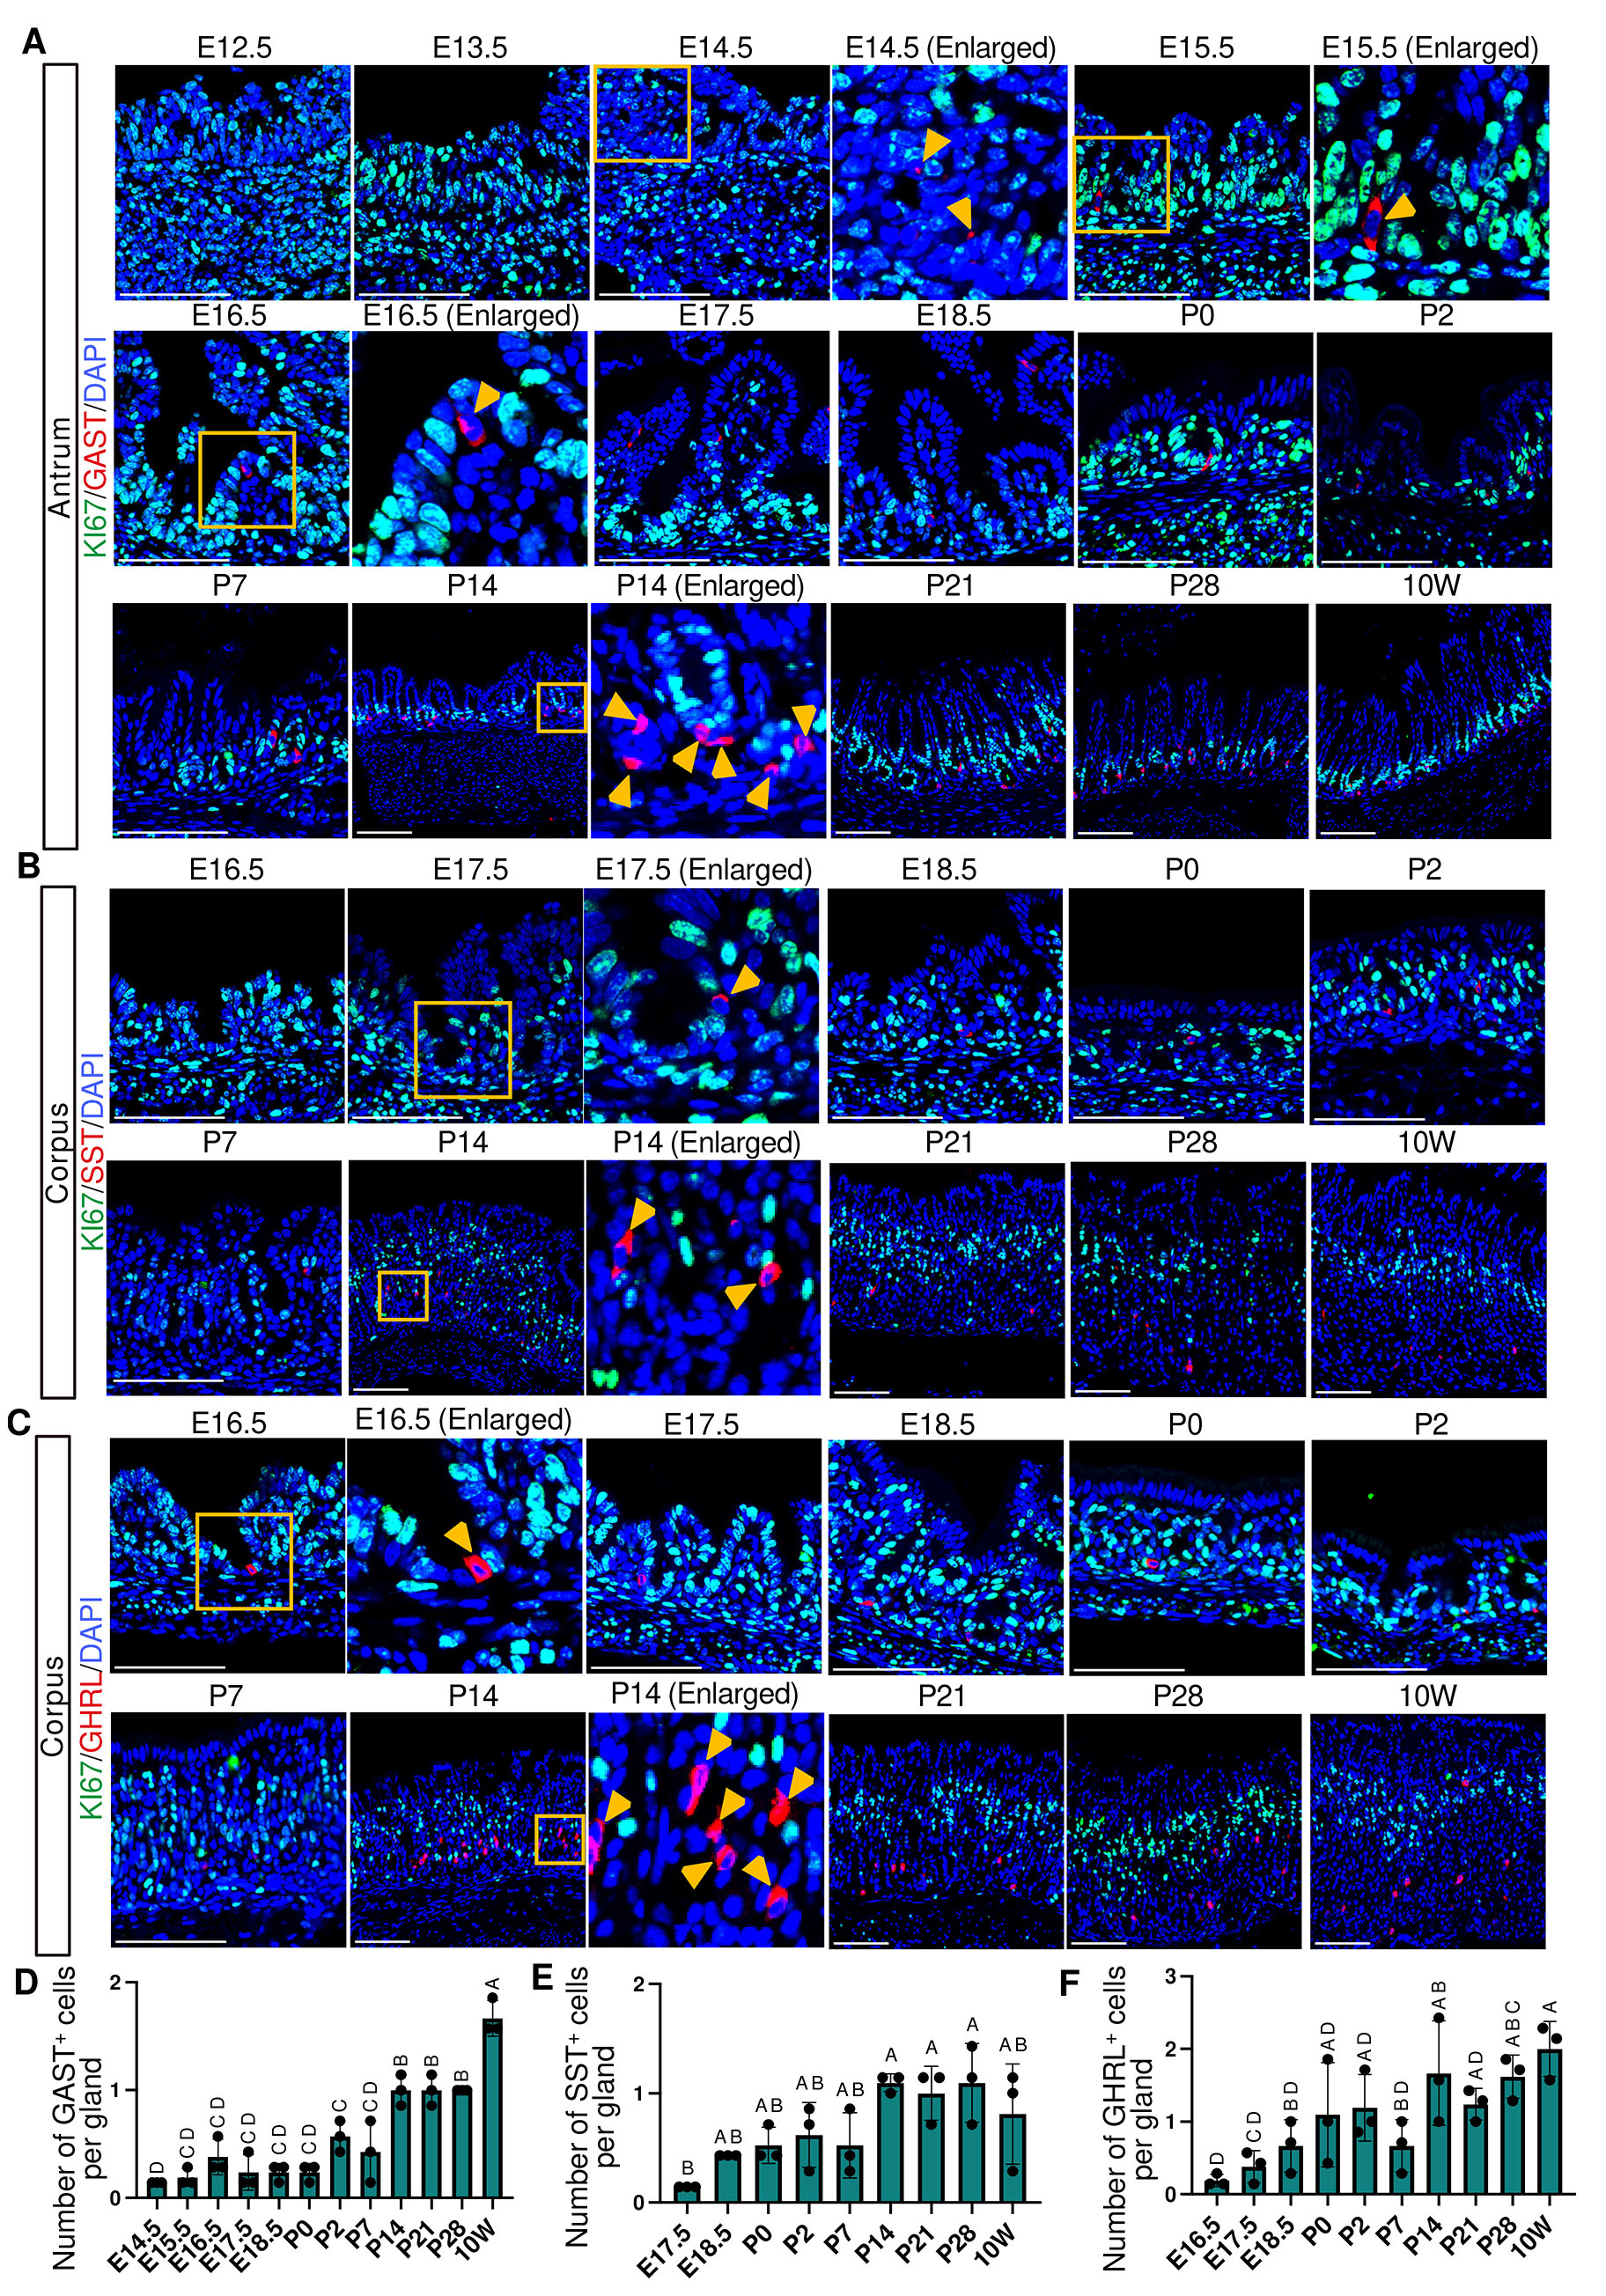
Fig. 9. Spatiotemporal expression of endocrine cell markers and KI67 in the corpus and antrum.
(A-C) Representative immunofluorescence images showing endocrine cell markers and KI67 expression. GAST (red) and KI67 (green) in the antrum (A), SST (red) and KI67 (green) in the corpus (B), and GHRL (red) and KI67 (green) in the corpus (C). For (A–C), nuclei were counterstained with DAPI (blue). Images are representative of n = 3 embryos or mice per stage. Scale bars: 100 μm. Orange arrowheads indicate GAST-positive cells (A), SST-positive cells (B), and GHRL-positive cells (C). (D-F) Developmental changes in the number of GAST+ cells (D), SST+ cells (E), and GHRL+ cells (F) per gland. For (D–F), each data point represents the mean of seven glands per mouse (n = 3 mice per stage). Data are presented as mean ± SD. Statistical analysis was performed using one-way ANOVA followed by Tukey’s multiple comparisons test. Groups not sharing the same letter are significantly different (p < 0.05).
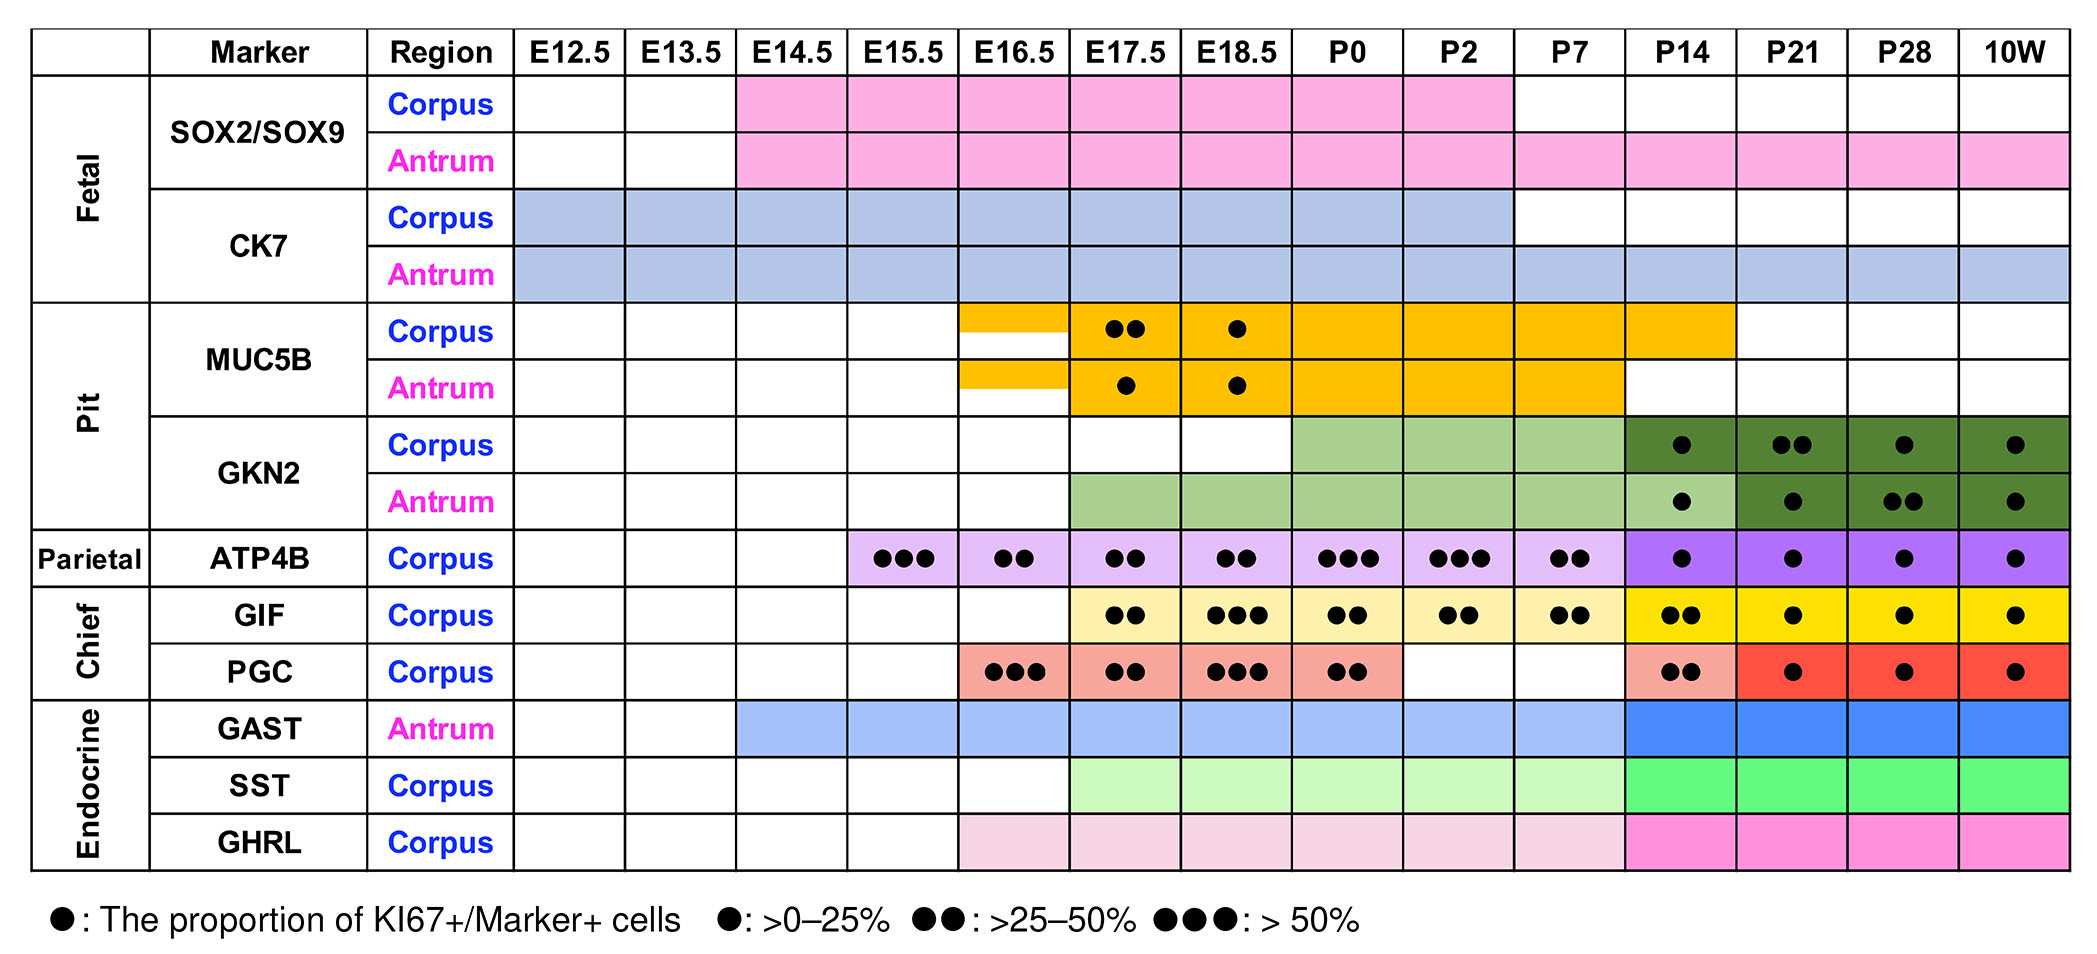
Fig. 10. Schematic overview of fetal and functional marker expression and the proportion of KI67-positive cells.
Colored boxes indicate detectable expression of the indicated markers at each developmental stage. For MUC5B at E16.5, expression was undetectable in one of three embryos; therefore, the corresponding box is half-shaded to indicate variable expression. For mature lineage markers, darker shading indicates stages at which the number of marker-positive cells per gland was significantly increased compared with the stage of initial marker appearance. PGC expression was transiently undetectable during early postnatal stages (P2–P7) and is therefore not shown as colored boxes. Colored boxes for “SOX9/SOX2” indicate developmental stages during which complementary expression patterns of SOX9 and SOX2 were observed. “Fetal” indicates markers preferentially expressed in immature gastric epithelial cells during embryonic and early postnatal stage. The number of black dots indicates the proportion of KI67-positive cells. For SOX2/SOX9 and CK7, the proportion of KI67-positive cells was not quantified and in therefore not indicated by black dots.
In contrast to other functional epithelial lineages including ATP4B+ parietal cells and PGC+ chief cells, endocrine cells showed no detectable overlap between hormone expression and cell-cycle activity. KI67+/GAST+, KI67+/SST+ and KI67+/GHRL+ cells were not observed at any developmental stages examined, from embryonic to adult tissue. These findings suggest that endocrine cells exit the cell cycle upon acquisition of functional hormone expression, which is distinct from other epithelial cell lineages that exhibit transient populations of KI67+ cells co-expressing terminal differentiation markers.
Discussion
Postnatal maturation of the stomach, which coincides with the transition from milk ingestion to solid food intake, has been well documented in both humans and mice. However, the detailed cellular events underlying this developmental transitions, particularly at the level of individual epithelial lineages, remain incompletely understood. In this study, through systematic immunofluorescence analysis across embryonic, postnatal, and adult stages, we visualized the temporal and spatial sequence through which each epithelial lineage initiates differentiation, downregulates fetal programs, and acquires a mature identity (Fig. 10). This in situ developmental atlas not only extends previous proteomic and transcriptomic studies by providing cell-type-specific insight into gastric epithelial maturation but also provides an anatomical framework for future investigations into gastric development.
By analyzing the dynamics of KI67+ proliferating epithelial cells, we found that epithelial lineages undergo maturation with markedly distinct kinetics. ATP4B+ parietal cells and GIF+ chief cells retained a substantial KI67+ population during early postnatal stages, with this progenitor fraction decreasing markedly by P14 and P21, respectively (Fig. 5D, 7D). In contrast, GKN2⁺ pit cells showed little to no detectable KI67⁺ proliferating population during early postnatal periods but acquired proliferative activity from P14 onward (Fig. 4C). These lineage-specific differences prompt the question of how postnatal maturation is differentially regulated across epithelial lineages. One possible mechanism promoting postnatal gastric maturation is corticosterone signaling, which rises sharply during the suckling-to-weaning transition and induces tissue-wide upregulation of mature functional markers, including Muc5ac in pit cells, Atp4a and Atp4b in parietal cells, and Pgc in chief cells (Ghizoni et al., 2014; Henning, 1978; Wang et al., 1996; Zulian et al., 2017). However, its broad mode of action is unlikely to fully account for the lineage-specific maturation kinetics observed in this study, thereby implicating the involvement of additional lineage-restricted regulatory mechanisms. In this context, it is noteworthy that epithelial lineage differentiation in adult homeostasis is regulated by distinct signaling pathways. EGFR signaling promotes pit cell differentiation, TNFSF12 signaling promotes progenitor cell proliferation, BMP signaling induces parietal cell differentiation, and suppression of both EGF and BMP signaling facilitates chief cell differentiation (Takada et al., 2023; Wölffling et al., 2021). Together, these findings suggest that lineage-specific maturation programs are driven by the coordinated and spatially restricted action of multiple signaling pathways. Elucidating these programs will require future spatial transcriptomic approaches to map the expression of signaling ligands, receptors, antagonists, and downstream effectors across developmental stages.
Although GIF+ chief cells and ATP4B+ parietal cells display a relatively high KI67+ proportion from embryonic stages through P7, their numbers per gland remain largely unchanged (Fig. 5 and 7). This likely reflects rapid gastric growth accompanied by an increase in gland number, such that increases in GIF+ and ATP4B+ cell numbers are more apparent at the organ level than within individual glands. In addition, studies in the pancreas have shown that early postnatal growth involves high proliferative activity coupled with extensive elimination of differentiated cells via apoptosis (Stolovich-Rain et al., 2023). Analogously, during embryonic and early postnatal stages of the stomach, GIF+ and ATP4B+ cells may not yet be stably maintained, and cell loss may limit net accumulation. In contrast, after P7, GIF+ and ATP4B+ cells accumulate within individual glands without an accompanying increase in the proportion of KI67+ cells, suggesting postnatal acquisition of long-term maintenance of these differentiated cells.
We identified a unique PGC expression pattern marked by a transient loss during early postnatal stages (Fig. 8 A,B). Although previous studies have described a developmental shift in pepsinogen composition, with chymosin predominating during the suckling period and PGC expression increasing around weaning (Li et al., 2018), the temporally disappearance of PGC expression has not been explicitly reported. Our findings therefore suggest that early postnatal regulatory mechanisms transiently suppress PGC expression. During this period, the gastric epithelium is directly exposed to luminal factors derived from maternal milk. Notably, maternal milk has been reported to contain EGF (Dvorak, 2010), and EGF signaling has been shown to suppress PGC expression in gastric epithelial cells (Takada et al., 2023; Wölffling et al., 2021), raising the possibility that milk-derived factors contribute to the timing of chief cell maturation. Further studies will be required to determine whether, and to what extent, maternal milk-derived factors regulate gastric epithelial maturation.
The timing of pit cell maturation was not uniform between the corpus and antrum. Both the loss of fetal pit-cell marker MUC5B and the emergence of the adult marker GKN2 occurred earlier in the antrum (Fig. 3A, 4A, 10), indicating accelerated pit cell maturation in the antrum. Consistent with this temporal difference, the antral mucosa also thickened and formed gland-like structures earlier than the corpus during midgestation (Fig. 1 A,B), highlighting broader region-specific differences in gastric development. This regional asynchrony conceptually parallels proximal-to-distal developmental waves described in the small intestine, where villus formation and the expression of enterocytes markers such as fatty acid-binding proteins and apolipoproteins emerge earlier in proximal regions (Kolev and Kaestner, 2023; Rubin et al., 1989; Walton et al., 2012). In the intestine, proximal-to-distal villus formation waves have been associated with Hedgehog signaling-mediated mesenchymal patterning and its subsequent refinement by BMP signaling (Walton et al., 2012; Walton et al., 2015). Whether analogous regionally patterned mechanisms operate in the stomach to drive regional differences in gastric gland formation and epithelial maturation remains unknown and will require further investigation.
In summary, our work delineates lineage- and region-specific trajectories of gastric epithelial maturation. This comprehensive in situ immunofluorescence analysis will facilitate future studies of the regulatory mechanisms underlying gastric development, maturation and disease-associated remodeling accompanied by reactivation of fetal-like programs.
Materials and Methods
Animals
All animal experiments were conducted in accordance with the guidelines approved by the Animal Welfare and Ethical Review Panel of the Nara Institute of Science and Technology (approval numbers 1702 and 2201). ICR mice were purchased from Japan SLC or CLEA Japan and were maintained under specific pathogen-free conditions. Mice were housed under a 12-h light-dark cycle at an ambient temperature of 23–24 °C and 50–70% humidity, with ad libitum access to food and water.
Tissue preparation and sectioning
For E12.5–P14 samples, whole stomachs were embedded and sagittal sections were prepared to include the forestomach, corpus, and antrum extending to the duodenal boundary within a single section. For P21, P28, and 10W samples, stomachs were bisected longitudinally and sagittal sections were prepared to include the forestomach, corpus, antrum up to duodenal boundary within a single section. For analysis, corpus regions on the forestomach side and antrum regions on the duodenum side were examined, while the intermediate region was excluded.
Immunofluorescence staining
For immunofluorescence staining, stomach samples were fixed in 4% paraformaldehyde in PBS at 4℃ for overnight, washed with PBS at 4℃ for 1 hour, and cryoprotected by sequential incubation in 10%, 20% and 30% sucrose solutions at 4℃ for 1 hour each. Samples were then embedded in O.C.T. compound, and frozen sections were prepared at a thickness of 5 μm using a Cryostat CM1860 (Leica Microsystems, Nussloch, Germany). For antigen retrieval, sections were incubated in 10 mM citrate buffer (pH 6.0) at 95℃ for 15 min using a cooker. Sections were then permeabilized with PBS containing 0.2% Triton for 10 min and blocked with PBS containing 5% fetal bovine serum at room temperature for 1 hour. Sections were incubated with primary antibodies at 4℃ overnight, washed three times with PBS for 10 min each, and then incubated with appropriate secondary antibodies at room temperature for 1 hour. Nuclei were counterstained with DAPI (Sigma-Aldrich, D9542). Immunofluorescence images were acquired using a confocal laser scanning microscope (LSM710, Carl Zeiss, Oberkochen, Germany). The following primary antibodies were used: anti-ATP4B (Santa Cruz, sc-374094, 1:3000), anti-Gastrin (Proteintech, 18143-1-AP, 1:1000), anti-Ghrelin (Proteintech, 13309-1-AP, 1:1000), anti-GIF (Santa Cruz, sc-161643, 1:400), anti-GKN2 (Abcam, ab188866, 1:800), anti-KRT7(Abcam, ab181598, 1:800), anti-MKI67 (homemade, 1:1000), anti-MKI67 (Thermo Fisher, 14-5698-82, 1:1000), anti-MUC5B (Atlas Antibodies, HPA008246, 1:200), anti-PGC (Abcam, ab255826, 1:400), anti-SOX2 (Invitrogen, 14-9811-37, 1:400), anti-SOX9 (Abcam, ab185230, 1:1000), and anti-Somatostatin (Santa Cruz, sc-7819, 1:800). The following secondary antibodies were used: Donkey anti-Goat IgG(H+L) Alexa Fluor 488 (Invitrogen, A-11055, 1:1000), Donkey anti-Rabbit IgG(H+L) Alexa Fluor 488 (Invitrogen, A-21206, 1:1000), Donkey anti-Rat IgG(H+L) Alexa Fluor 488 (Invitrogen, A-21208, 1:1000), Donkey anti-mouse IgG(H+L) Alexa Fluor 488 (Invitrogen, A-21202, 1:1000), Donkey anti-Rabbit IgG(H+L) Alexa Fluor 555 (Invitrogen, A-31572, 1:1000), Donkey anti-Rat IgG(H+L) Alexa Fluor 555 (Invitrogen, A78945, 1:1000), Donkey anti-Rabbit IgG(H+L) Alexa Fluor 647 (Invitrogen, A-31573, 1:1000), and Donkey anti-mouse IgG(H+L) Alexa Fluor 647 (Invitrogen, A-31571, 1:1000).
Quantification and statistical analysis
Quantification of immunofluorescence images, including counting of KI67/marker or SOX9/marker double-positive cells, was performed manually using Fiji (National Institutes of Health). Statistical analyses were conducted using GraphPad Prism (version 10.6.1). The specific statistical tests applied, as well as sample sizes (n), are indicated in corresponding figure legends.
Supplementary Material
Acknowledgements
We thank the NAIST Life Science Collaboration Center (LiSCo) for supporting this study. This work was supported by grants from NAIST Granite (N.M.), Mishima Kaiun Memorial Foundation (H.T.), Suzuken Memorial Foundation (H.T.), JSPS KAKENHI Grant (22K06789 to H.T. and 23K28414 to A.K.), and JST FOREST Program, Grant Number JPMJFR240Y (H.T.).
Declarations
Conflicts of interest
The authors declare no conflict of interest.
Author contributions
N.M. performed experiments, analyzed the data, and revised the manuscript. Y.T. performed experiments and analyzed the data. A.K. supervised the project and revised the manuscript. H.T. supervised the project, analyzed the data, and wrote and revised the manuscript. All authors reviewed and approved the final manuscript.
References
Alpers D. H., Russell-Jones G. (2013). Gastric intrinsic factor: The gastric and small intestinal stages of cobalamin absorption. A personal journey. Biochimie 95: 989-994.
Dvorak B. (2010). Milk Epidermal Growth Factor and Gut Protection. The Journal of Pediatrics 156: S31-S35.
Francis R., Guo H., Streutker C., Ahmed M., Yung T., Dirks P. B., He H. H., Kim T.H. (2019). Gastrointestinal transcription factors drive lineage-specific developmental programs in organ specification and cancer. Science Advances 5: eaax8898.
Ghizoni H., Figueiredo P. M., Moisan M.P., Ogias D., Osaki L. H., Gama P. (2014). Regulation of corticosterone function during early weaning and effects on gastric cell proliferation. Nutrition 30: 343-349.
Han S., Fink J., Jörg D. J., Lee E., Yum M. K., Chatzeli L., Merker S. R., Josserand M., Trendafilova T., Andersson-Rolf A., Dabrowska C., Kim H., Naumann R., Lee J.H., Sasaki N., Mort R. L., Basak O., Clevers H., Stange D. E., Philpott A., Kim J. K., Simons B. D., Koo B.K. (2019). Defining the Identity and Dynamics of Adult Gastric Isthmus Stem Cells. Cell Stem Cell 25: 342-356.e7.
Henning S. J. (1978). Plasma concentrations of total and free corticosterone during development in the rat.. American Journal of Physiology-Endocrinology and Metabolism 235: E451.
Jain R. N., Samuelson L. C. (2006). Differentiation of the Gastric Mucosa II. Role of gastrin in gastric epithelial cell proliferation and maturation. American Journal of Physiology-Gastrointestinal and Liver Physiology 291: G762-G765.
Kageyama T. (2002). Pepsinogens, progastricsins, and prochymosins: structure, function, evolution, and development. Cellular and Molecular Life Sciences CMLS 59: 288-306.
Karam S. M. (2010). A focus on parietal cells as a renewing cell population. World Journal of Gastroenterology 16: 538.
Karam S. M., Leblond C. P. (1993). Dynamics of epithelial cells in the corpus of the mouse stomach. I. Identification of proliferative cell types and pinpointing of the stem cell. The Anatomical Record 236: 259-279.
Kataoka K., Sakano Y. (1984). Panoramic observation of the mouse gastric mucosa by superwide-field electron microscopy.. Archivum histologicum japonicum 47: 209-221.
Keeley T. M., Samuelson L. C. (2010). Cytodifferentiation of the postnatal mouse stomach in normal and Huntingtin-interacting protein 1-related-deficient mice. American Journal of Physiology-Gastrointestinal and Liver Physiology 299: G1241-G1251.
Kim T.H., Kim B.M., Mao J., Rowan S., Shivdasani R. A. (2011). Endodermal Hedgehog signals modulate Notch pathway activity in the developing digestive tract mesenchyme. Development 138: 3225-3233.
Kim T.H., Shivdasani R. A. (2016). Stomach development, stem cells and disease. Development 143: 554-565.
Kirchner T., Müller S., Hattori T., Mukaisyo K., Papadopoulos T., Brabletz T., Jung A. (2001). Metaplasia, intraepithelial neoplasia and early cancer of the stomach are related to dedifferentiated epithelial cells defined by cytokeratin-7 expression in gastritis. Virchows Archiv 439: 512-522.
Koh T.J., Goldenring J.R., Ito S., Mashimo H., Kopin A.S., Varro A., Dockray G.J., Wang T.C. (1997). Gastrin deficiency results in altered gastric differentiation and decreased colonic proliferation in mice. Gastroenterology 113: 1015-1025.
Kolev H. M., Kaestner K. H. (2023). Mammalian Intestinal Development and Differentiation—The State of the Art. Cellular and Molecular Gastroenterology and Hepatology 16: 809-821.
Li X., Zhang C., Gong T., Ni X., Li J., Zhan D., Liu M., Song L., Ding C., Xu J., Zhen B., Wang Y., Qin J. (2018). A time-resolved multi-omic atlas of the developing mouse stomach. Nature Communications 9: 4910.
Matsuo J., Douchi D., Myint K., Mon N. N., Yamamura A., Kohu K., Heng D. L., Chen S., Mawan N. A., Nuttonmanit N., Li Y., Srivastava S., Ho S. W. T., Lee N. Y. S., Lee H. K., Adachi M., Tamura A., Chen J., Yang H., Teh M., So J. B.Y., Yong W. P., Tan P., Yeoh K. G., Chuang L. S. H., Tsukita S., Ito Y. (2021). Iqgap3-Ras axis drives stem cell proliferation in the stomach corpus during homoeostasis and repair. Gut 70: 1833-1846.
McCracken K. W., Aihara E., Martin B., Crawford C. M., Broda T., Treguier J., Zhang X., Shannon J. M., Montrose M. H., Wells J. M. (2017). Wnt/β-catenin promotes gastric fundus specification in mice and humans. Nature 541: 182-187.
Mesquita da Silva K., Rattes I. C., Pereira G. M. A., Gama P. (2021). Lifelong Adaptation of Gastric Cell Proliferation and Mucosa Structure to Early Weaning-Induced Effects. Frontiers in Physiology 12: 721242.
Rubin D. C., Ong D. E., Gordon J. I. (1989). Cellular differentiation in the emerging fetal rat small intestinal epithelium: mosaic patterns of gene expression.. Proceedings of the National Academy of Sciences 86: 1278-1282.
Sankoda N., Tanabe W., Tanaka A., Shibata H., Woltjen K., Chiba T., Haga H., Sakai Y., Mandai M., Yamamoto T., Yamada Y., Uemoto S., Kawaguchi Y. (2021). Epithelial expression of Gata4 and Sox2 regulates specification of the squamous–columnar junction via MAPK/ERK signaling in mice. Nature Communications 12: 560.
Shao J., Sartor R. B., Dial E., Lichtenberger L. M., Schepp W., Alpers D. H. (2000). Expression of Intrinsic Factor in Rat and Murine Gastric Mucosal Cell Lineages Is Modified by Inflammation. The American Journal of Pathology 157: 1197-1205.
Stolovich-Rain M., Fridlich O., Azulai S., Klochendler A., Anzi S., Magenheim J., Stein I., Mushasha F., Glaser B., Pikarsky E., Ben-Zvi D., Dor Y. (2023). Extensive elimination of acinar cells during normal postnatal pancreas growth. Cell Reports 42: 113457.
Takada H., Sasagawa Y., Yoshimura M., Tanaka K., Iwayama Y., Hayashi T., Isomura-Matoba A., Nikaido I., Kurisaki A. (2023). Single-cell transcriptomics uncovers EGFR signaling-mediated gastric progenitor cell differentiation in stomach homeostasis. Nature Communications 14: 3750.
Teramoto M., Sugawara R., Minegishi K., Uchikawa M., Takemoto T., Kuroiwa A., Ishii Y., Kondoh H. (2020). The absence of SOX2 in the anterior foregut alters the esophagus into trachea and bronchi in both epithelial and mesenchymal components. Biology Open 9: bio048728.
Walthall K., Cappon G. D., Hurtt M. E., Zoetis T. (2005). Postnatal development of the gastrointestinal system: A species comparison. Birth Defects Research Part B: Developmental and Reproductive Toxicology 74: 132-156.
Walton K. D., Kolterud A., Czerwinski M. J., Bell M. J., Prakash A., Kushwaha J., Grosse A. S., Schnell S., Gumucio D. L. (2012). Hedgehog-responsive mesenchymal clusters direct patterning and emergence of intestinal villi. Proceedings of the National Academy of Sciences 109: 15817-15822.
Walton K. D., Whidden M., Kolterud A., Shoffner S., Czerwinski M. J., Kushwaha J., Parmar N., Chandhrasekhar D., Freddo A. M., Schnell S., Gumucio D. L. (2015). Villification in the mouse: Bmp signals control intestinal villus patterning. Development 143: 427-436.
Wang Z.M., Aizman R., Grahnquist L., Yasui M., Hemphälä A., Celsi G. (1996). Glucocorticoids Stimulate the Maturation of H,K-ATPase in the Infant Rat Stomach. Pediatric Research 40: 658-663.
Wei Y., Xu Z., Hu M., Wu Z., Liu A., Czajkowsky D. M., Guo Y., Shao Z. (2023). Time‐resolved transcriptomics of mouse gastric pit cells during postnatal development reveals features distinct from whole stomach development. FEBS Letters 597: 418-426.
Widmayer P., Kusumakshi S., Hägele F. A., Boehm U., Breer H. (2017). Expression of the Fatty Acid Receptors GPR84 and GPR120 and Cytodifferentiation of Epithelial Cells in the Gastric Mucosa of Mouse Pups in the Course of Dietary Transition. Frontiers in Physiology 8: 601.
Willet S. G., Mills J. C. (2016). Stomach Organ and Cell Lineage Differentiation: From Embryogenesis to Adult Homeostasis. Cellular and Molecular Gastroenterology and Hepatology 2: 546-559.
Willet S. G., Thanintorn N., McNeill H., Huh S.H., Ornitz D. M., Huh W. J., Hoft S. G., DiPaolo R. J., Mills J. C. (2023). SOX9 Governs Gastric Mucous Neck Cell Identity and Is Required for Injury-Induced Metaplasia. Cellular and Molecular Gastroenterology and Hepatology 16: 325-339.
Wölffling S., Daddi A. A., Imai-Matsushima A., Fritsche K., Goosmann C., Traulsen J., Lisle R., Schmid M., Reines-Benassar M. M., Pfannkuch L., Brinkmann V., Bornschein J., Malfertheiner P., Ordemann J., Link A., Meyer T. F., Boccellato F. (2021). EGF and BMPs Govern Differentiation and Patterning in Human Gastric Glands. Gastroenterology 161: 623-636.e16.
Yoneda M., Shiraishi J., Kuraishi T., Aoki F., Imakawa K., Sakai S. (2001). Gastric Proteinase Digestion of Caseins in Newborn Pups of the Mouse. Journal of Dairy Science 84: 1851-1855.
Zulian J. G., Hosoya L. Y. M., Figueiredo P. M., Ogias D., Osaki L. H., Gama P. (2017). Corticosterone activity during early weaning reprograms molecular markers in rat gastric secretory cells. Scientific Reports 7: 45867.