Int. J. Dev. Biol. 68: 251 - 262 (2024)
Special Issue: Developmental Biology in Nordic Countries
Ccer1 is a spermatid-specific gene required for spermatogenesis and male fertility
Open Access | Original Article | Published: 22 January 2025
Abstract
Male infertility is a multifactorial condition for which the underlying causes frequently remain undefined. Genetic factors have long been associated with male fertility. However, many of them are poorly or not at all characterized and their biological functions are unknown. Identifying the key genes behind male infertility is crucial for improving prognosis and treatment options, as well as for evaluating the risk of passing on genetic defects through natural or assisted reproductive methods to the next generation. Here, we have studied the Coiled-coil domain-containing glutamate-rich protein 1 (Ccer1), a poorly characterized gene specific to vertebrates. We demonstrate that it is enriched during spermiogenesis in spermatids in both mice and humans. The studied Ccer1 knockout mice exhibit significant subfertility due to the absence of Ccer1 function, which leads to altered sperm head and tail ultrastructure. This study defines Ccer1 as a spermatid-specific gene critical for spermiogenesis, suggesting it would be worthwhile inspecting when there is a suspicion of male infertility associated with genetic causes.
Keywords
spermatogenesis, round spermatids, male infertility, sperm motility
Introduction
Impaired male fertility is the cause in about 20% and a contributing factor in up to 40% of infertility cases (Njagi et al., 2023; Tüttelmann et al., 2018). Male infertility is a prevalent and highly heterogeneous disease for which the underlying causes remain undefined in up to 70% of the instances (Tüttelmann et al., 2018), and in almost 40% of male infertility cases its genetic etiology remains unclear (Joseph and Mahale, 2021). In recent years, a growing number of studies have been published on the genetics and epigenetics of male infertility using a broad range of genomic technologies (Oud et al., 2019). Genome-wide transcriptomics analyses of the molecular components indicate that about 84% of all human (Uhlén et al., 2015) and about 90% of mouse (Schultz et al., 2003) protein-coding genes are co-expressed in the testis, pointing out that sperm production is a complex process involving numerous biological pathways. Additionally, studies predict that about 5% of all genes are expressed specifically in testes (Djureinovic et al., 2014). Currently, only a fraction of the genes involved in testes development, descent, and spermatogenesis have been well studied and shown to have clinical significance (Houston et al., 2022), laying the basis for this study aimed at characterization of a yet poorly studied testes-enriched gene.
Well-formed spermatozoa are an essential prerequisite for fertility. Spermatogenesis is the process of spermatozoa (sperm) formation. It is unique and distinct from any other biological process in the body, and as discussed above, requires numerous ubiquitously and testes-specifically expressed genes dedicated to establishing and facilitating sperm formation and function (Joseph and Mahale, 2021; Okada, 2022; Yan, 2009). Spermatogenesis takes place simultaneously at different times in different regions of the testicular seminiferous tubules to secure even production and availability of mature sperm. Spermiogenesis, the phase when round spermatids mature into spermatozoa, is the final stage of spermatogenesis (Han, 2024; Miyata et al., 2024; Nishimura and L’Hernault, 2017). A mature sperm cell is composed of a head and a flagellum, and these two distinct parts are shaped during round spermatid development (Nishimura and L’Hernault, 2017). The head contains a compact nucleus, carrying haploid genetic material together with a multitude of other factors critical for fertilization (Wu and Chu, 2008). The flagellum, subdivided into a midpiece, a principal piece, and an end piece, propels the movement of sperm cells. The axonemal structure, composed of two centrally located singlets and nine externally located doublet microtubules, extends through the entire flagellum. Additionally, the midpiece, attached to the sperm head, is surrounded by a mitochondria layer providing energy and outer dense fibers extending to the principal piece. The principal piece also contains a fibrous sheath, which underlies the plasma membrane and surrounds the outer dense fibers. The sperm cell ends with a rather short end piece comprised of only axonemal structures (Eddy et al., 2003; Lindemann and Lesich, 2016).
In mice, spermatid development is divided into 16 developmental steps. Spermatids in steps 1–8 are referred to as early and 9–16 as late spermatids, progressing from round to elongated spermatids and finally to spermatozoa (Meistrich and Hess, 2013). During steps 1–7 of mouse spermiogenesis, round spermatids are distinguished by a spherical, decondensed nucleus situated in the center of the cell (Kleene, 1996). At the same time, assembly of the acrosome from vesicles in the Golgi complex and the axoneme formation begin (Meistrich and Hess, 2013). During the following step 8, the nucleus and acrosome polarize to one side of the cell, leading to the elongation phase of spermiogenesis. Simultaneously, the nucleus starts to change shape alongside nuclear compaction and chromatin condensation (O’Donnell, 2014). The steps 9–16 are referred to as late spermiogenesis steps when nuclear elongation and condensation take place (Meistrich and Hess, 2013). More specifically, in the early elongating spermatid cells, steps 9–10, active gene transcription of many genes slows down and stops at late spermatid steps 12–13 (Braun, 1998). The remaining steps 13–16 are referred to as elongated spermatids, and the full cell and nucleus elongation is achieved. Both elongating and elongated spermatids undergo changes in chromatin structure and a cessation of transcription, which enables chromatin condensation and is needed for translational regulation of certain mRNAs (Kleene, 1996; Ren et al., 2017). It is worth noting that even though overall transcription stops, the translation of several proteins goes on either immediately or is delayed until the protein is required later in spermiogenesis (Braun, 1998).
Another major event occurring during spermiogenesis (steps 1–16) is the assembly of the sperm flagellum. The central component of the flagellum, the axoneme composed of microtubules, is assembled shortly after the completion of meiosis II. Later, as spermatids elongate, the above-mentioned accessory structures needed for flagella function such as outer dense fibers, fibrous sheath, and mitochondrial sheath are assembled around the central axoneme (Escalier, 2006; O’Donnell, 2014). This facilitates the acquisition of swimming properties characteristic of sperm cells. Spermiogenesis culminates with the process called spermiation, when fully developed spermatids shed off the remaining cytoplasm, are released into the lumen of seminiferous tubules, and are called spermatozoa. The spermatozoa are released to the seminiferous tubule lumen and relocated into the epididymis for further maturation (Hermo et al., 2010).
As the foundation of this study, we identified from in silico databases a yet poorly characterized testes-enriched gene, the Coiled-coil domain-containing glutamate-rich protein 1 (Ccer1), which is a one exon-containing, intronless gene in both mice and humans. The resulting CCER1 protein is 406 aa long in human (Q8TC90) and 403 aa long in mouse (Q9CQL2) and features predicted intrinsically disordered and coiled-coil regions. We show that Ccer1 is indeed a testes-specific gene expressed throughout early spermiogenesis. The Ccer1 knockout (KO) mouse line that we generated revealed severe subfertility in the absence of Ccer1 function attributed to altered sperm head and tail ultrastructure associated with motility and contractility.
Results
CCER1 originates in vertebrates
We selected to focus on CCER1, a still rather poorly characterized protein-coding gene and protein, based on our in silico database search of testis-enriched genes. We started by reviewing its presence across the tree of life. A series of homology searches against publicly available databases, such as NCBI, showed that the CCER1 protein appears only in vertebrates starting with cartilaginous fish (Chondrichthyes), such as small-spotted catshark (Scyliorhinus canicular, Fig. 1A), but appears to be absent in jawless fish (Agnatha, Fig. 1A). CCER1 is present in bony fish (Osteichthyes) and in all studied four-limbed (Tetrapoda) vertebrates including amphibians (Amphibia), reptiles (Reptilia), birds (Aves) and mammals (Mammalia; Fig. 1 A; Fig. S1; Table S1).
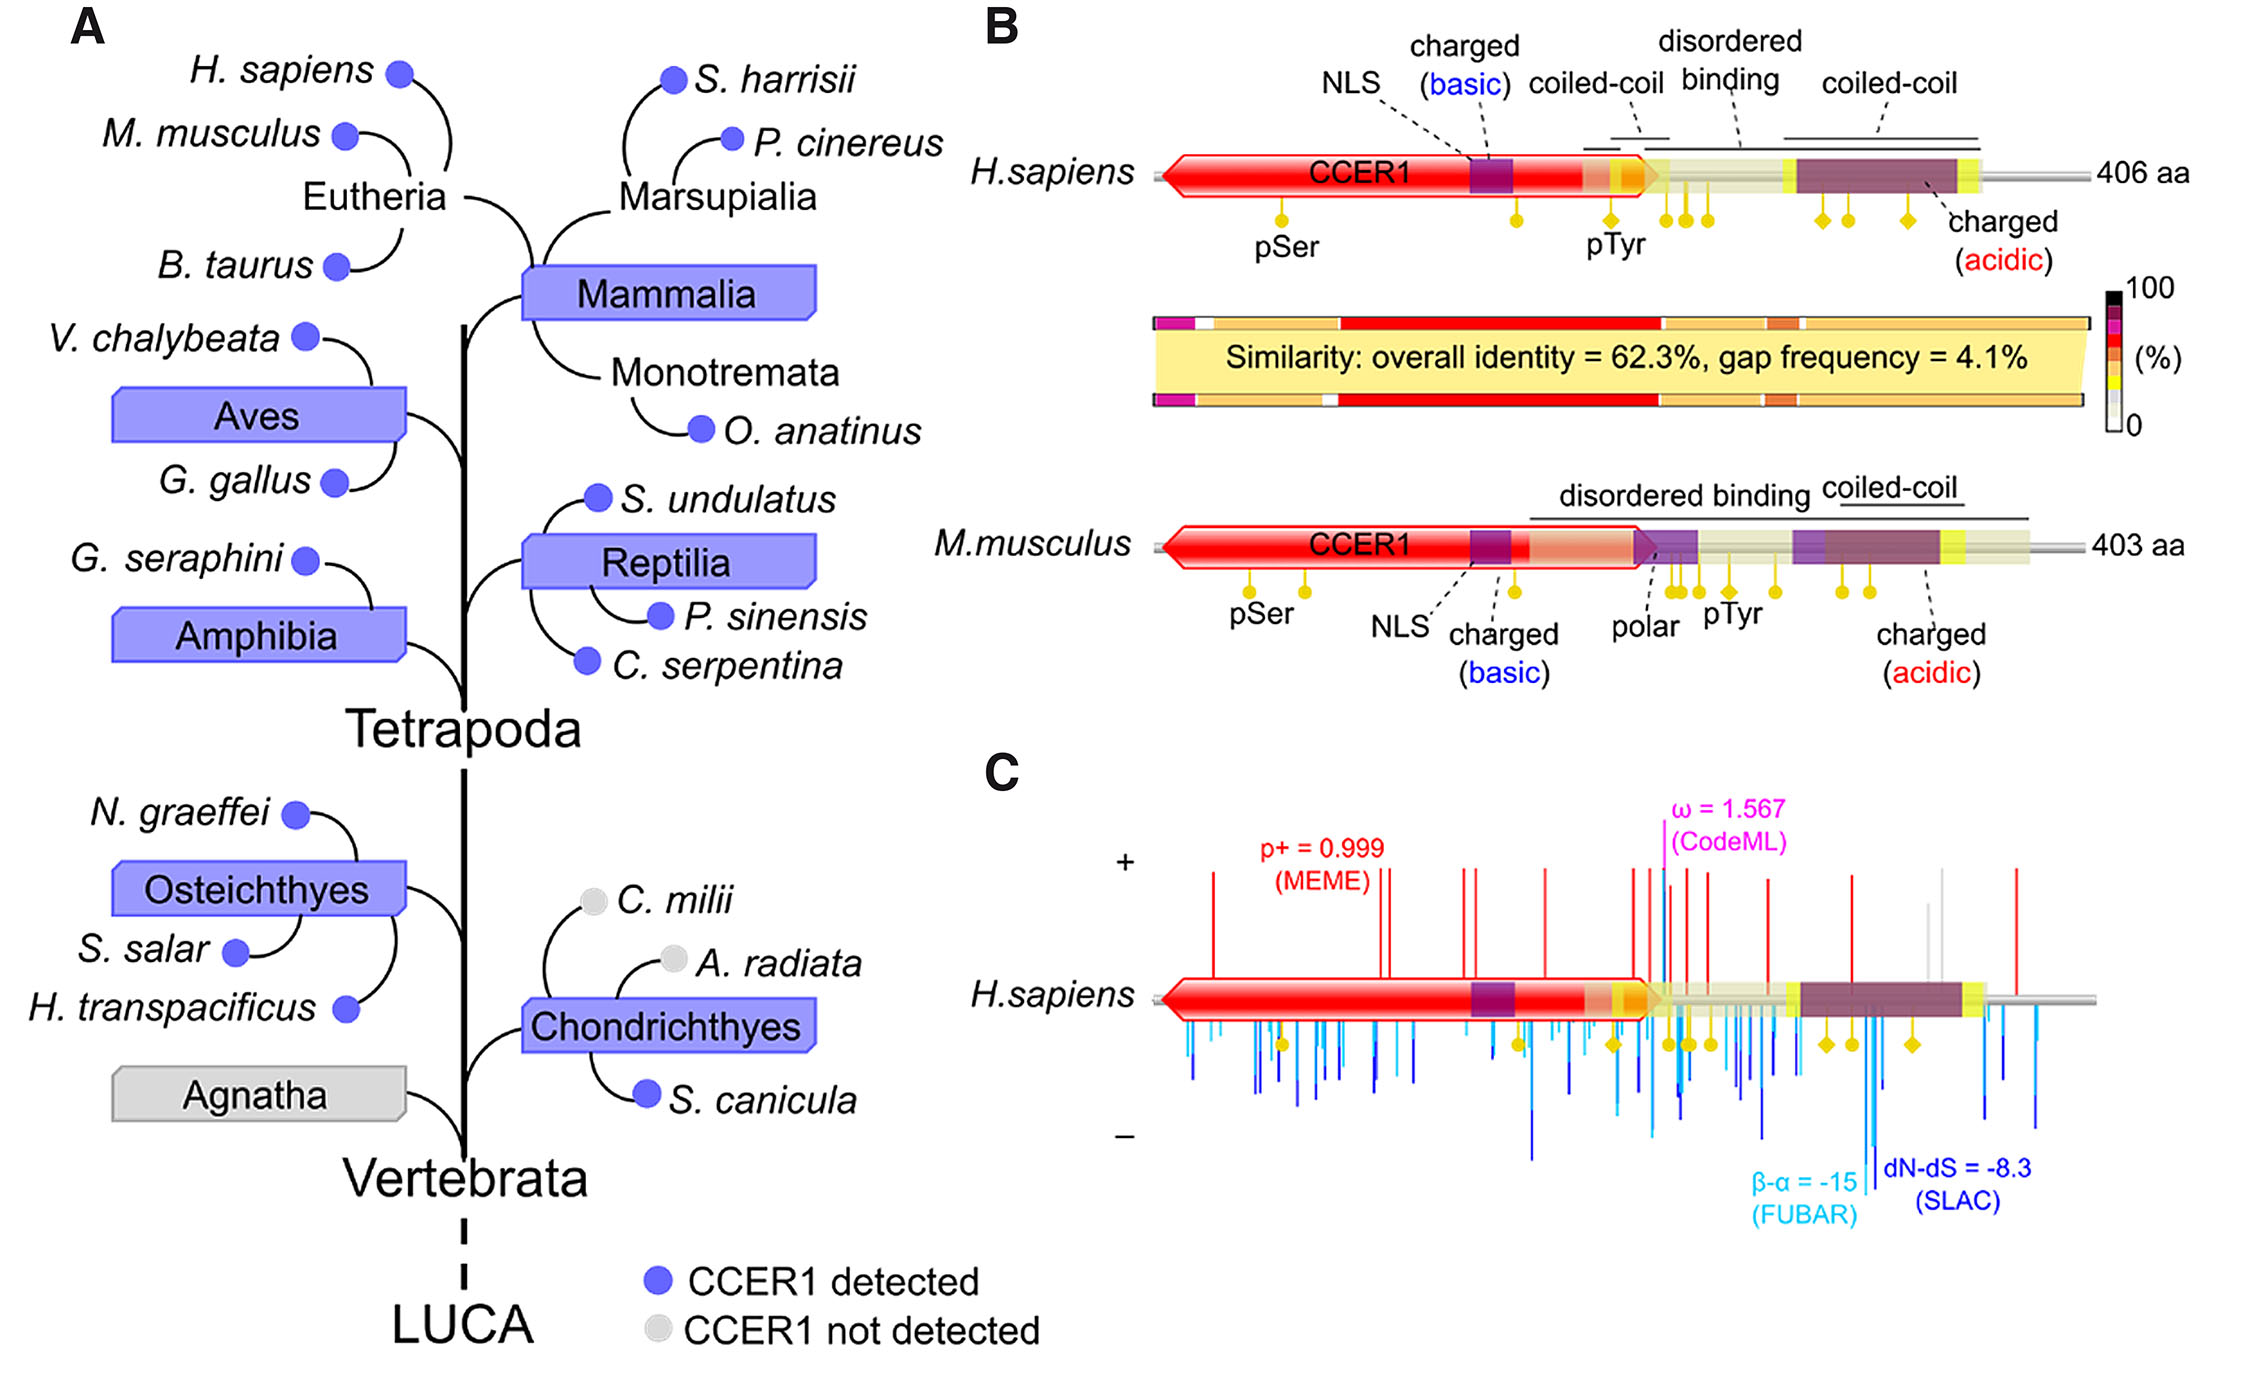
Fig. 1. Coiled-coil containing glutamate (E)-Rich protein family 1 (CCER1) protein topology and evolutionary selection.
(A) CCER1 orthologous sequences were found in vertebrates, but not in evolutionarily earlier domains of life. (B) Shared characteristics between human and mouse CCER1 protein. Indicated are predicted phosphorylation targets on serine (pSer) and tyrosine (pTyr), nuclear-localization signal (NLS) regions, regions rich in basic, acidic, or polar amino acids, coiled-coil shorter regions, intrinsically disordered protein binding regions and Coiled-coil containing glutamate (E)-Rich protein family 1 (CCER1) domain. The varying sequence similarity between human and mouse CCER1 is plotted along their CCER1 protein schemes. (C) Evolutionary selection on sites. Positive (+) and negative (–) selection in primates (species are listed in Table S1) was plotted onto CCER1 protein topology from human. The highest values for each of the four methods used are indicated as an example: MEME (log p+ mixture distribution weight allocated to β+), CodeML (postmean ω: the ratio of dN/dS), FUBAR (mean posterior β-α), SLAC (dN-dS scaled by the length of the tested branches). Selection on sites from a region of the alignment deemed as unreliable are shown in gray.
CCER1 protein topology suggests interaction capabilities, and the CCER1 gene bears signatures of evolutionary adaptation
To get a glimpse of the putative molecular functional properties of CCER1, we characterized its amino acid sequences from human and mouse (Fig. 1B). The protein has a relatively large, N-terminal CCER1 (Coiled-coil containing glutamate (E)-Rich protein family 1) domain and a shorter coiled-coil (cc) region towards the C-terminus. A short patch of basic amino acids is found in the CCER1 domain, containing a predicted nested nuclear localization signal, while a larger region of acidic amino acids resides in the C-terminal cc-region. We also predicted a large intrinsically disordered binding region, stretching from the end of the CCER1 domain to the end of the cc-region, and past it, in the case of mouse. Various short functional motifs were predicted for both human and mouse CCER1, of which seven were found to overlap between the two species (Fig. S2A), including the nuclear localization signal. Numerous putative phosphorylation sites were found for both human and mouse sequences (Fig. 1B). CCER1 from mouse has a central polar region, which is not found in human. The overall CCER1 amino acid sequence identity between humans and mice is a little over 60%, with similarity varying between the different regions of the protein. The highest identity was observed in the CCER1 domain, particularly the N-terminal part.
The relatively low protein sequence homology between human and mouse made us look into the evolutionary history of the gene. Focusing on human, we analyzed the natural selection pressure of CCER1 coding DNA sequence (CDS) in primates using the methods implemented in HyPhy and PAML suites. Plotting onto the protein topology of the translated sequence, our results show that negative (purifying) and positive selection have operated in a combined fashion (Fig. 1C, Fig. S2 A,B, and Tables S2-6). Notably, two short functional motifs were outlined to be under negative (purifying) selection in primates: a MAPK docking ligand motif and a WW-domain ligand motif (Fig. S2B). In addition, we detected relatively low rates of negative and positive selection (Fig. S2C).
Ccer1 is a testes-enriched gene, and its deletion leads to fertility defects in male mice
The analysis of open-access single-cell RNA sequencing (RNAseq) data from the entire Human Protein Atlas (Karlsson et al., 2021) shows that CCER1 expression is detected almost exclusively during spermatogenesis, where it becomes highly expressed in early spermatids and remains rather high in late spermatids and, to much lower extent, in spermatocytes (Fig. S3). We next performed multi-tissue reverse transcription polymerase chain reaction (RT-PCR) which showed that Ccer1 expression is enriched in normal mouse testes and detectable also in the epididymis (Fig. 2A). RT-PCR of testes at different ages showed that Ccer1 is expressed in the testes beginning from postnatal (P) day 25, the stage coinciding with round spermatid development during the first wave of spermatogenesis (Ernst et al., 2019), and Ccer1 expression continues throughout adulthood (Fig. 2B). In order to verify the Ccer1 expression pattern we generated a plasmid for the production of a digoxigenin (DIG)-labelled antisense RNA probe. In situ hybridization in the wild-type (WT) testes with the Ccer1 antisense probe overlayed with nuclear DAPI staining showed Ccer1 expression in all round spermatids (Fig. 2 C-E, Fig. S4 A,B). We also observed Ccer1 expression in elongating spermatids, which morphologically resembled most likely step 9 spermatids (Fig. 2 C’-E’). Simultaneously, only residual background staining was detected in Ccer1 KO testes (Fig. S4 C,D).
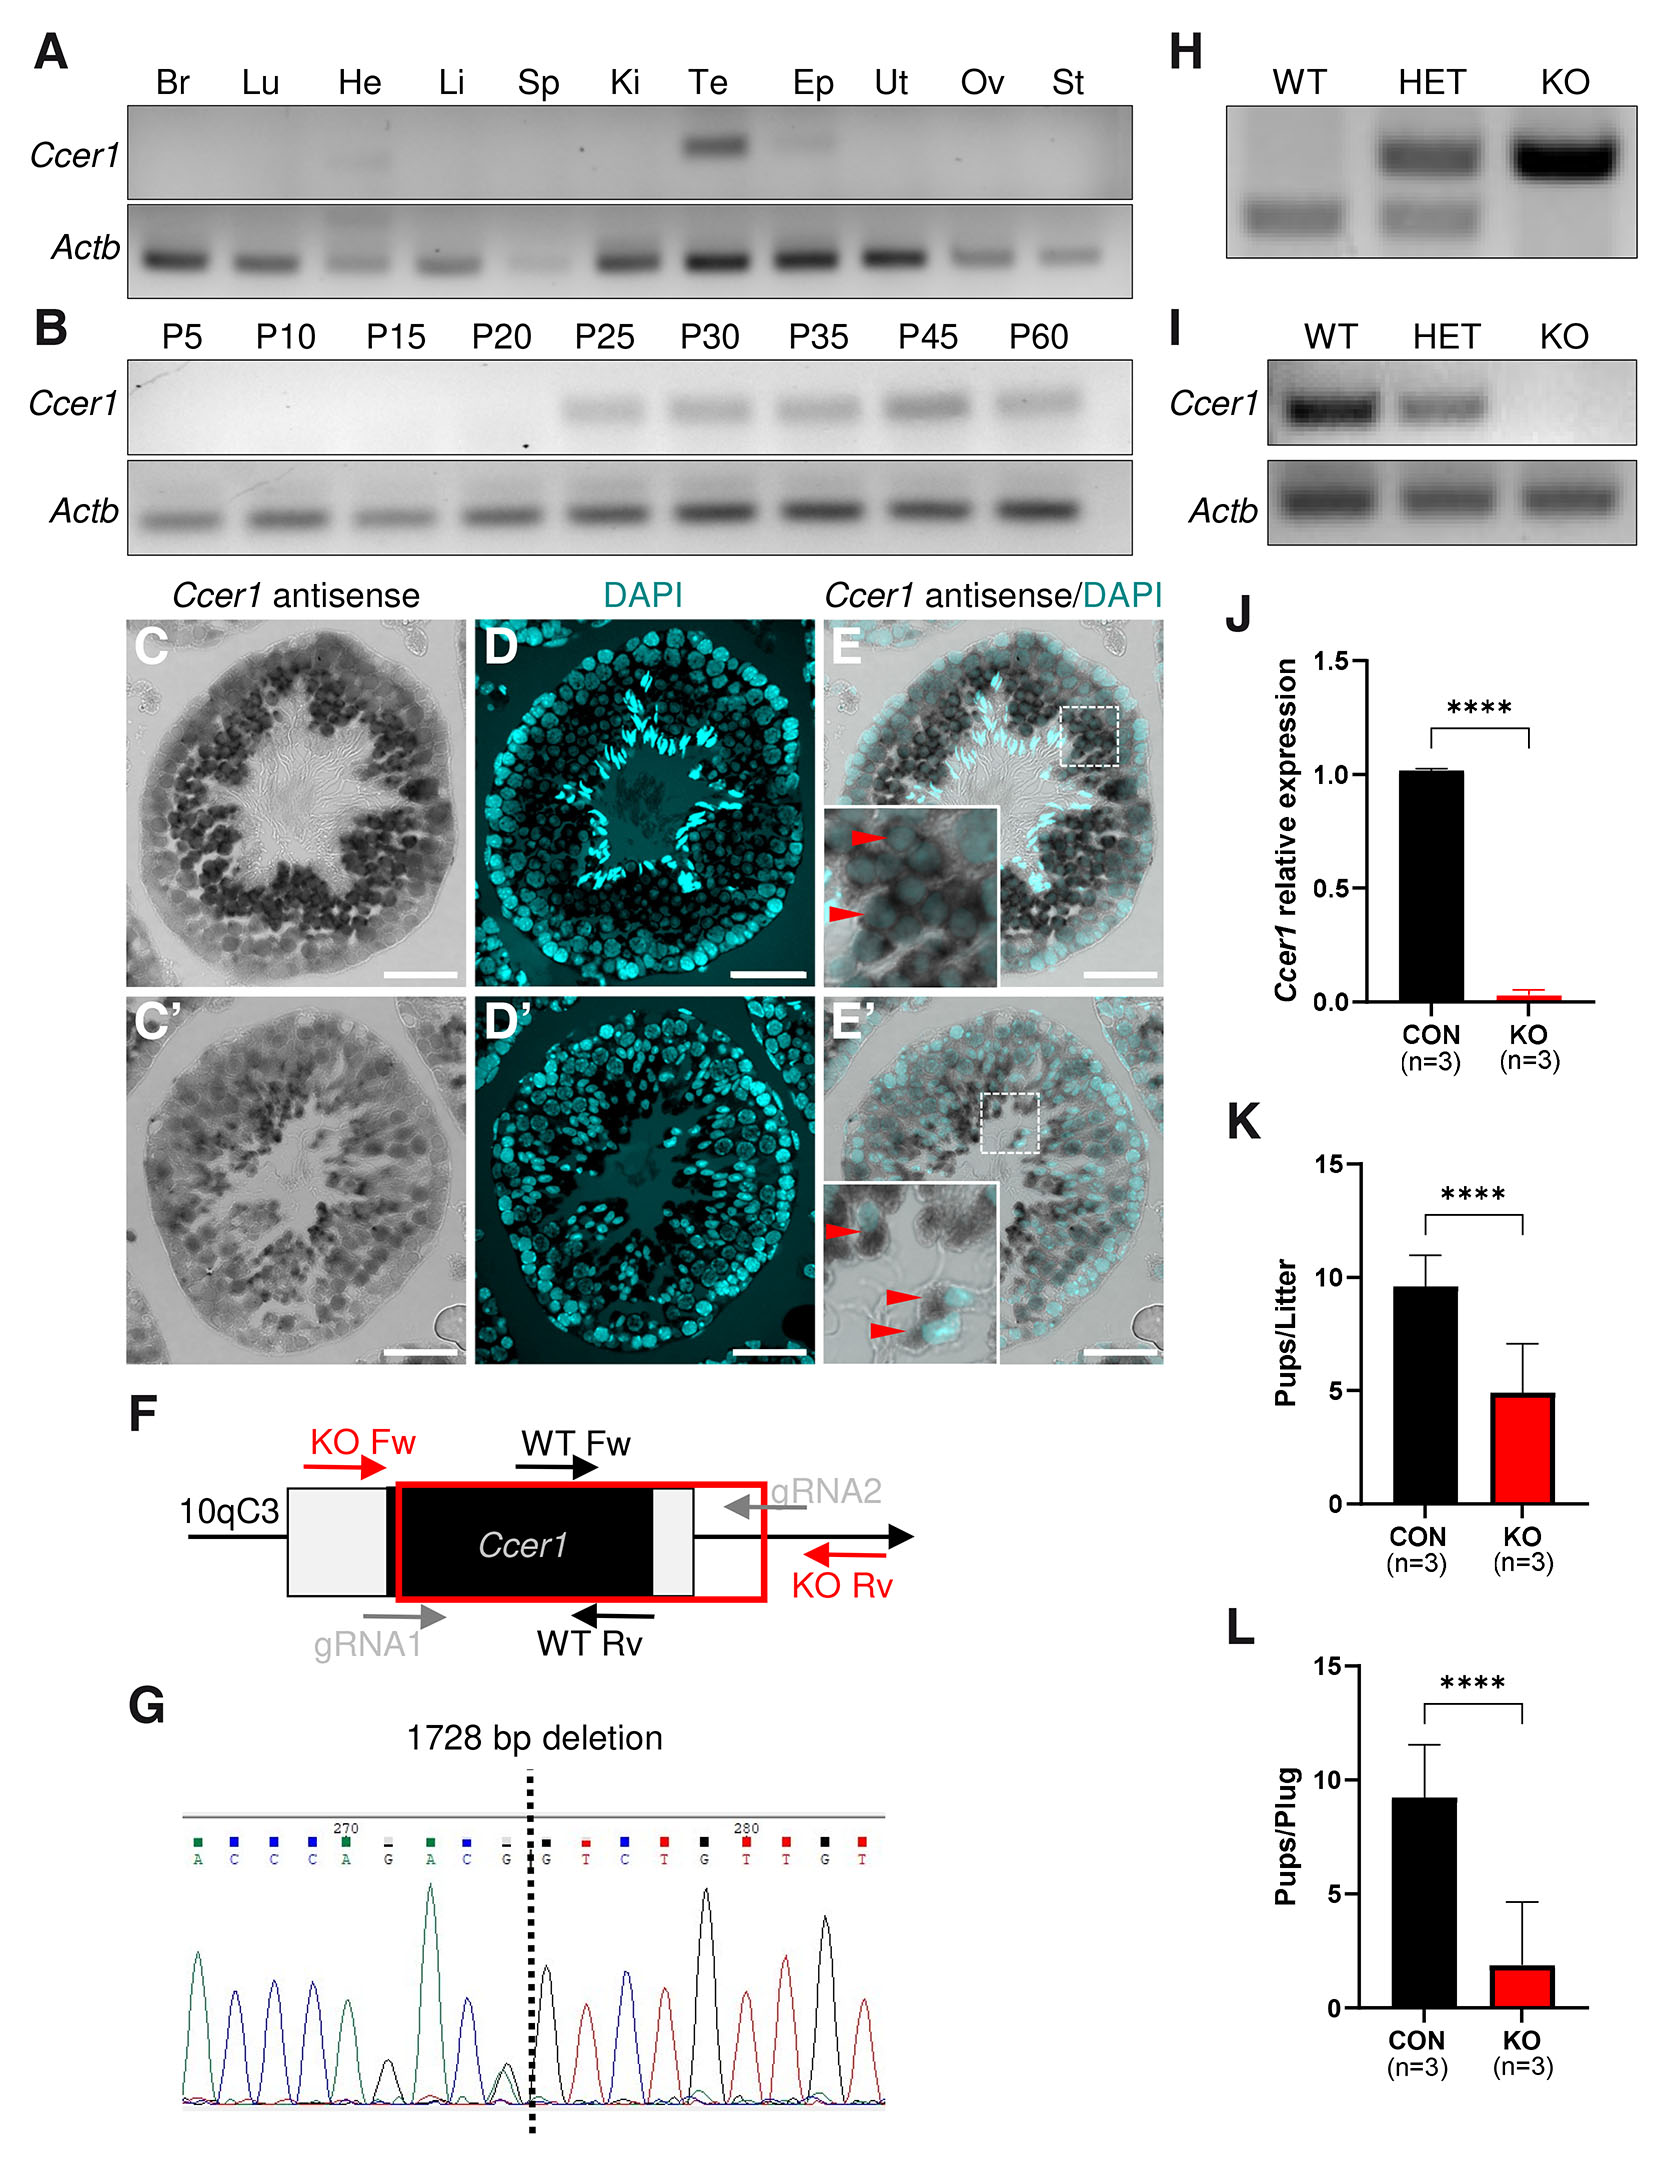
Fig. 2. Ccer1 expression is testes-enriched, and its deletion leads to fertility defects.
(A) Mouse multi-tissue RT-PCR profile of Ccer1 gene expression. Actb was used as a loading control. (B) Ccer1 starts to be expressed in mouse testes from P25 onwards as indicated by RT-PCR analysis. Actb was used as a loading control. (C-E’) In situ hybridization with Ccer1 antisense probe (C,C’) and DAPI (D,D’) staining of mouse testis cross-sections show Ccer1 expression in round spermatids (E, red arrowheads) and in elongated spermatids (E’, red arrowheads). (F) Schematic representation of the Ccer1 allele. Black boxes are coding alleles, white are non-coding, and the red box shows the deleted part. Genotyping primer pairs for wild type (WT) are marked WT Fw and WT Rv and for knockout (KO) KO Fw and KO Rv, and gRNA (gray) indicates genome editing. (G) Ccer1 deletion validation by Sanger sequencing. (H) PCR genotyping of Ccer1 wild type (WT), heterozygous (HET), and knockout (KO) mice. (I, J) Ccer1 deletion verification in wild type (WT), heterozygous (HET), and knockout (KO) testes by RT-PCR (I) and RT-qPCR (J). Actb (I) and Gapdh (J) were used as controls. Three animals were used in control and Ccer1 KO groups (J). (K) Ccer1 KO mice sire significantly fewer pups per litter as compared to the control mice. (L) Ccer1 KO mice have significantly fewer pups per plug as compared to the control. Three animals were used in control and Ccer1 KO groups (K,L). Abbreviations: Br, Brain; Lu, lung; He, heart; Li, liver; Sp, spleen; Ki, kidney; Te, testis; Ep, epididymis; Ut, uterus; Ov, ovary; St, stomach. ****P ≤ 0.0001, Student’s t-test; mean±SD. Scale bar: (C-E’) 40 µm.
To explore the function of the one exon-containing Ccer1 gene, we generated knockout mouse models using the CRISPR/Cas9 system (Fig. 2F). Of the 68 fertilized oocytes that were electroporated, 59 two-cell embryos were transplanted into the oviducts of two pseudopregnant female mice. 20 pups were born and 11 of them had introduced deletions, and subsequent mating was performed to obtain the next generation. The usage of two single guide RNAs (gRNA) enabled the deletion of a 1728 bp region spanning the exonic and part of the non-coding intronic region of Ccer1 (Fig. 2F). The deletion was confirmed by Sanger sequencing (Fig. 2G), PCR of genomic DNA (Fig. 2H), RT-PCR of testicular cDNA (Fig. 2I), and real-time quantitative polymerase chain reaction (RT-qPCR) of WT and Ccer1 KO testes (Fig. 2J).
The Ccer1 KO mice did not show any obvious developmental abnormalities or differences in sexual behavior as judged by the presence of a copulation plug. The breeding showed that control males sired 9.6±1.38 whereas Ccer1 KO males sired 4.9±2.18 pups per litter (mean±SD, n=3, p<0.0001, Fig. 2K). To gain a greater understanding if all mating attempts resulted in life births, we analyzed the number of pups born per detected copulation plug. The data showed that control males sired 9.25±2.32 and Ccer1 KO males sired 1.8±2.76 pups per plug (mean±SD, n=3, p<0.0001, Fig. 2L) demonstrating that many Ccer1 KO matings did not produce any pups. The reduced litter size and pup count per plug suggest that Ccer1 KO males are subfertile.
Sperm motility is compromised in the Ccer1 KO mice
A closer phenotypic analysis showed that Ccer1 KO testes size (Fig. 3A) and testes weight adjusted to body mass (Fig. 3B) were comparable to controls. Ccer1 KO testes cross-sections stained with Periodic acid-Schiff (PAS) staining showed seminiferous tubules containing cells of all differentiation stages, including meiocytes, round spermatids, and spermatozoa, similarly as in control (Fig. 3 C,D). Testicular sperm spreads were also comparable in control and Ccer1 KO mice (Fig. 3 E,F). Wheat germ agglutinin (WGA) lectin staining depicted spermatids and spermatocyte cells forming acrosome both in control and Ccer1 KO mice (Fig. 3 G,H) (Oura et al., 2020).
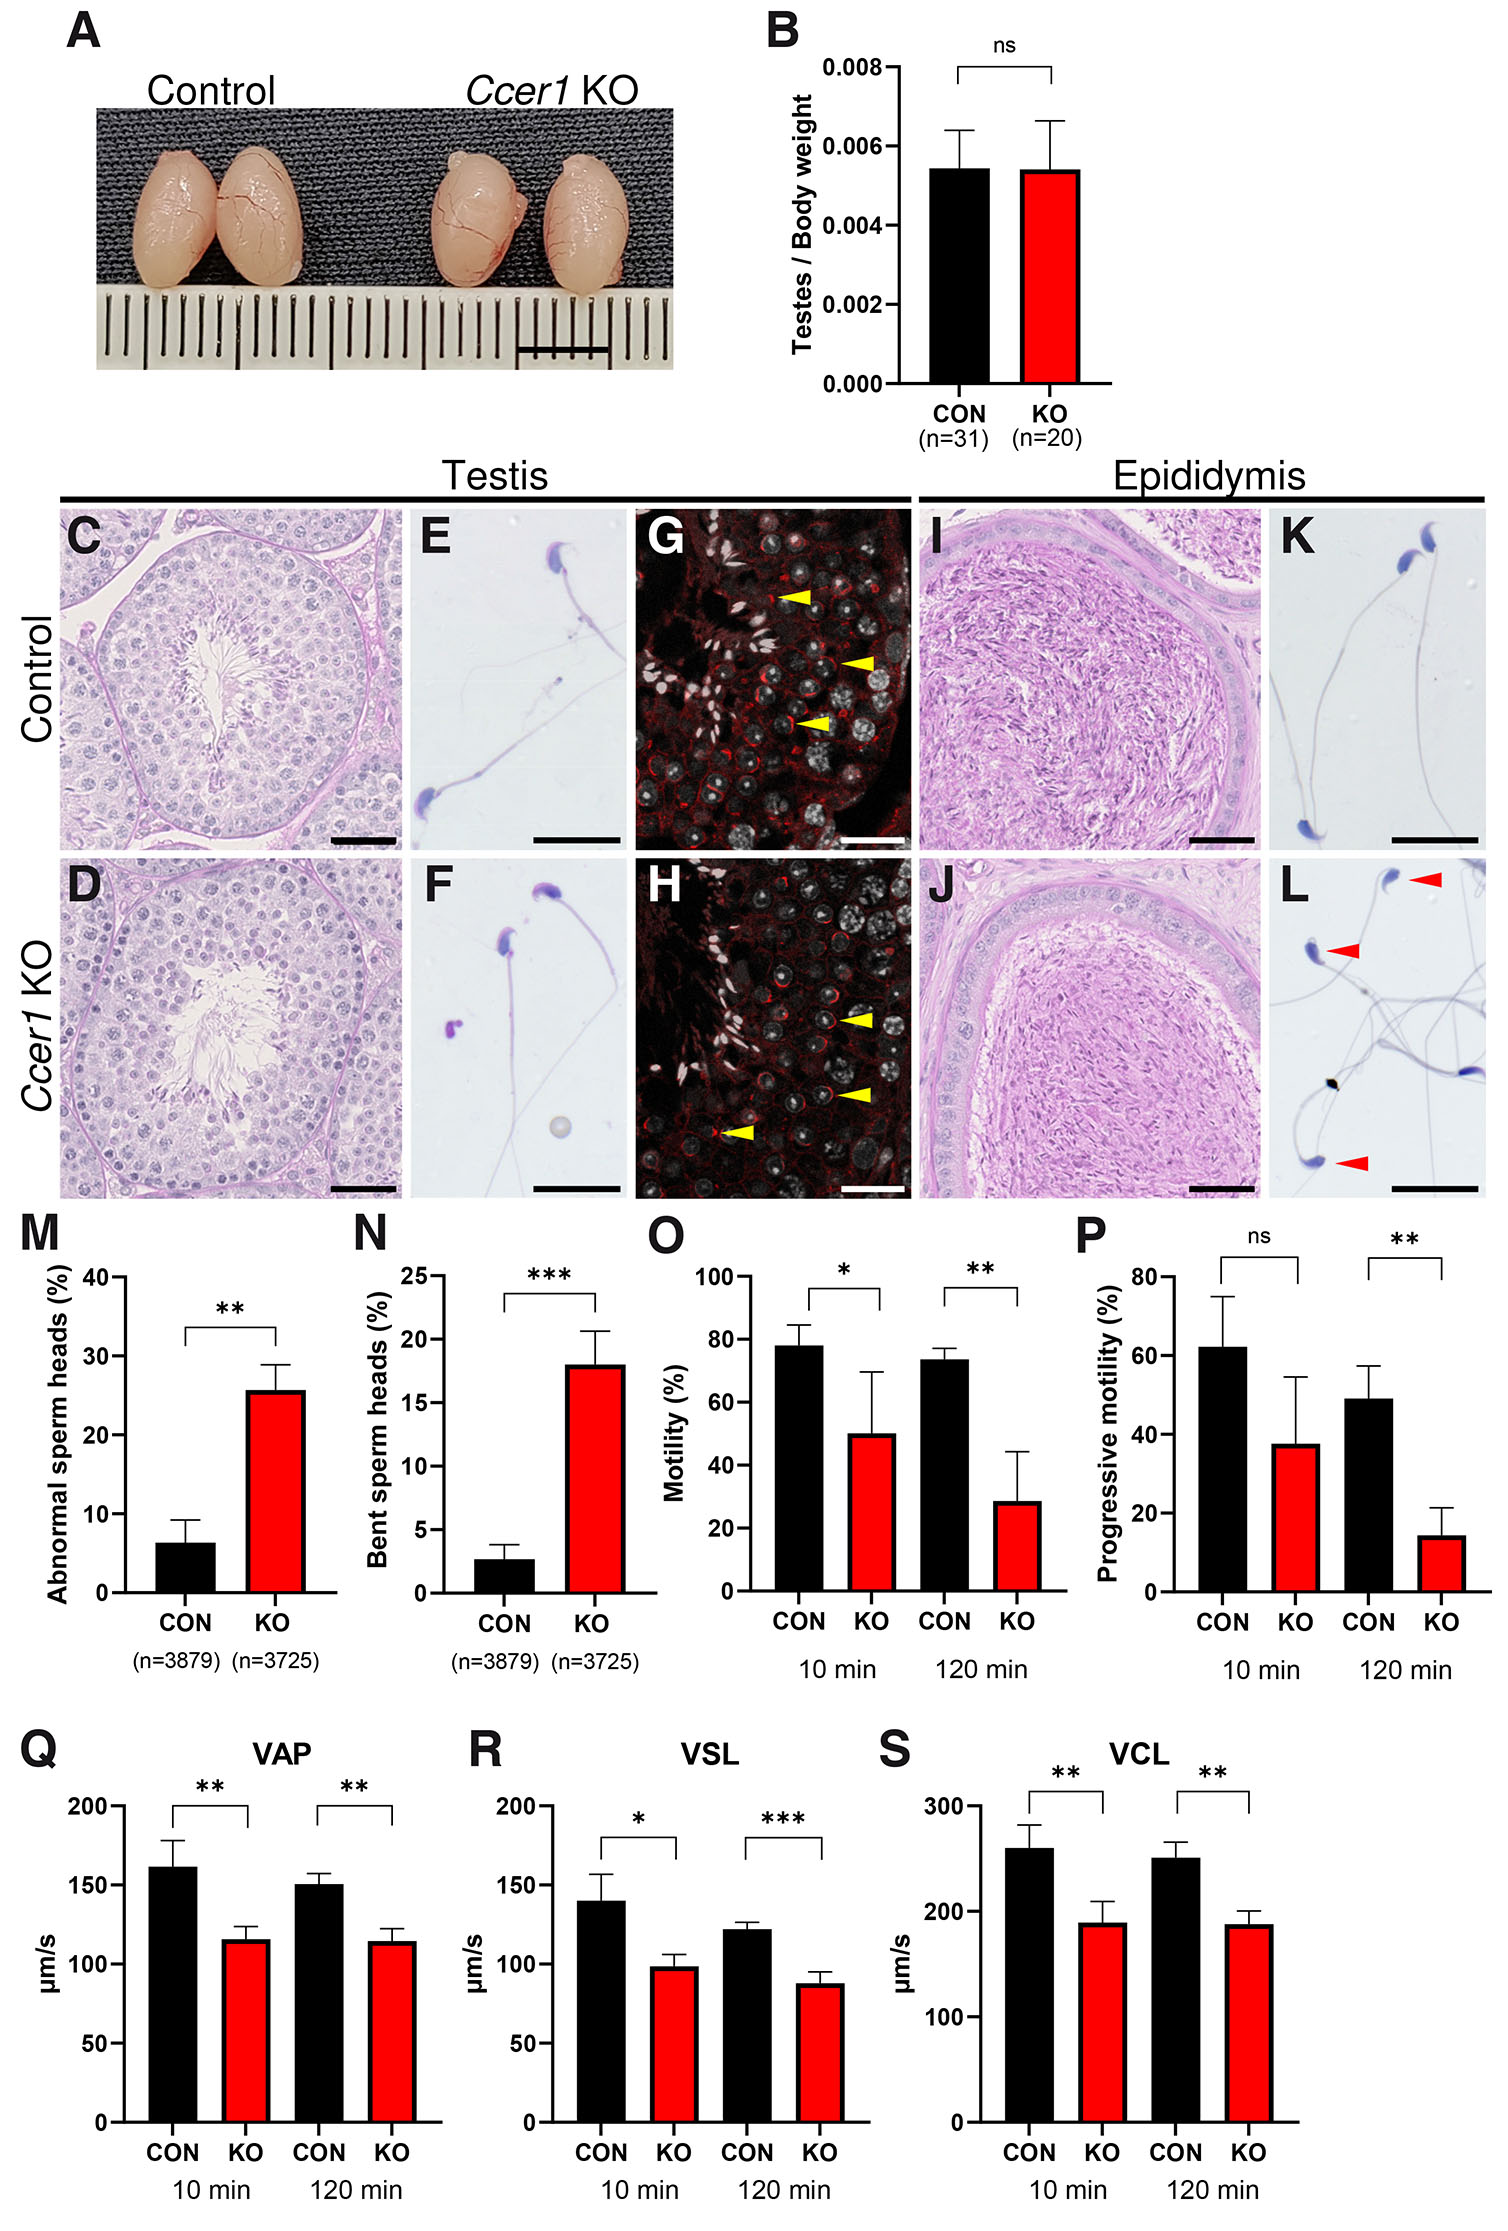
Fig. 3. Ccer1 deletion impairs sperm head morphology and sperm motility.
(A) Testes gross morphology and size were not changed in Ccer1 KOs as compared to the controls. (B) Testes weight was not changed in Ccer1 KOs. (C,D) PAS staining of control (C) and Ccer1 KO (D) testes cross-sections. (E,F) PAS staining of testicular spermatozoa of control (E) and Ccer1 KOs (F). (G,H) Testes stained by WGA-lectin depicting acrosomes (red) and DAPI depicting nuclei (white) in control (G) and Ccer1 KO (H) mice. Yellow arrowheads point to acrosomes. (I,J) PAS-stained epididymis in control (I) and Ccer1 KO (J) mice. (K,L) PAS staining of epididymal spermatozoa in control (K) and Ccer1 KO (L) mice; note bent sperm heads in L (red arrowheads). (M) Abnormal-looking epididymal sperm counts were increased in Ccer1 KOs. 3879 sperm cells from three control animals and 3725 sperm cells from three Ccer1 KO animals were counted. (N) Of the abnormal sperm head phenotype presented in (M), the bent sperm head phenotype was dominant in Ccer1 KO sperm. (O) Motile sperm cell counts were reduced in Ccer1 KOs after 10 min (P=0.041) and 120 min (P=0.0023). (P) Progressive sperm cell counts were reduced in Ccer1 KO after 120 min (P=0.0012). (Q-S) Sperm motility parameters: average path velocity (VAP, Q), straight-line velocity (VSL, R), and curvilinear velocity (VCL, S) values were significantly reduced in Ccer1 KOs after 10 min (VAP: P=0.0071; VSL: P=0.0109; VCL: P=0.0072) and 120 min (VAP: P=0.0012; VSL: P=0.0005; VCL: P=0.002) post-capacitation as compared to controls. ns, not significant; *P≤0.05; **P≤0.01; and ***P≤0.001, Student’s t-test; mean±SD. For CASA measurements, (O-S) three animals were used for both control and Ccer1 KO groups. Scale bars: A, 5 mm; C, D, G, H, I, J, 40 µm; E, F, K, L, 20 µm.
Evaluation of PAS staining of the caudal part of the epididymis showed spermatozoa present in both the control and Ccer1 KO epididymis (Fig. 3 I,J). However, epididymal sperm spreads of Ccer1 KO mice displayed an abnormal-looking sperm head phenotype not seen in the controls (Fig. 3 K,L). Quantification showed that 25.67% of Ccer1 KO epididymal sperm had gross-morphologically abnormal sperm heads as compared to the control specimens, which had abnormalities in only 6.33% of all evaluated cells (P=0.0015; Fig. 3M). A more detailed analysis of abnormal sperm head cases, presented in Fig. 3M, showed that the bent head phenotype was the most common and comprised 18% of all sperm cells in Ccer1 KO mice, in comparison to 2.67% in the control group (P=0.0008; Fig. 3 N,L).
Next, we examined sperm motility by computer-assisted sperm analysis (CASA) after incubation in Toyoda, Yokoyama, and Hoshi (TYH) medium for 10 min, representing non-capacitated sperm, and for 120 min, representing capacitated sperm. The results showed that sperm motility was reduced in Ccer1 KOs as compared to the control mice, both after 10 min and 120 min of incubation in TYH (Fig. 3O). The progressive cell counts were comparable in control and Ccer1 KO in non-capacitated cells after 10 min but plummeted significantly in Ccer1 KOs after 120 min (Fig. 3P). Closer examination of motility parameters, such as average path velocity (VAP, average velocity of the sperm head through its average trajectory), straight-line velocity (VSL, average velocity of the sperm head through the straight line connecting the first position with the last track) and curvilinear velocity (VCL, the average velocity of the sperm head through its real path), showed that they were significantly reduced in Ccer1 KOs, as compared to the controls both after 10 and 120 min (Fig. 3 Q-S). This shows that Ccer1 deletion leads to epididymal sperm morphological changes and motility defects.
Ccer1 deletion causes severe abnormalities in the sperm head morphology
Scanning electron microscope (SEM) images of caudal epididymis sperm (Fig. 4 A-E) depicted well-shaped control sperm cells with a characteristic hook on the tip of the cell (Fig. 4C), while Ccer1 KOs had many cells with bent or otherwise abnormal sperm cell morphology (Fig. 4 D,E).
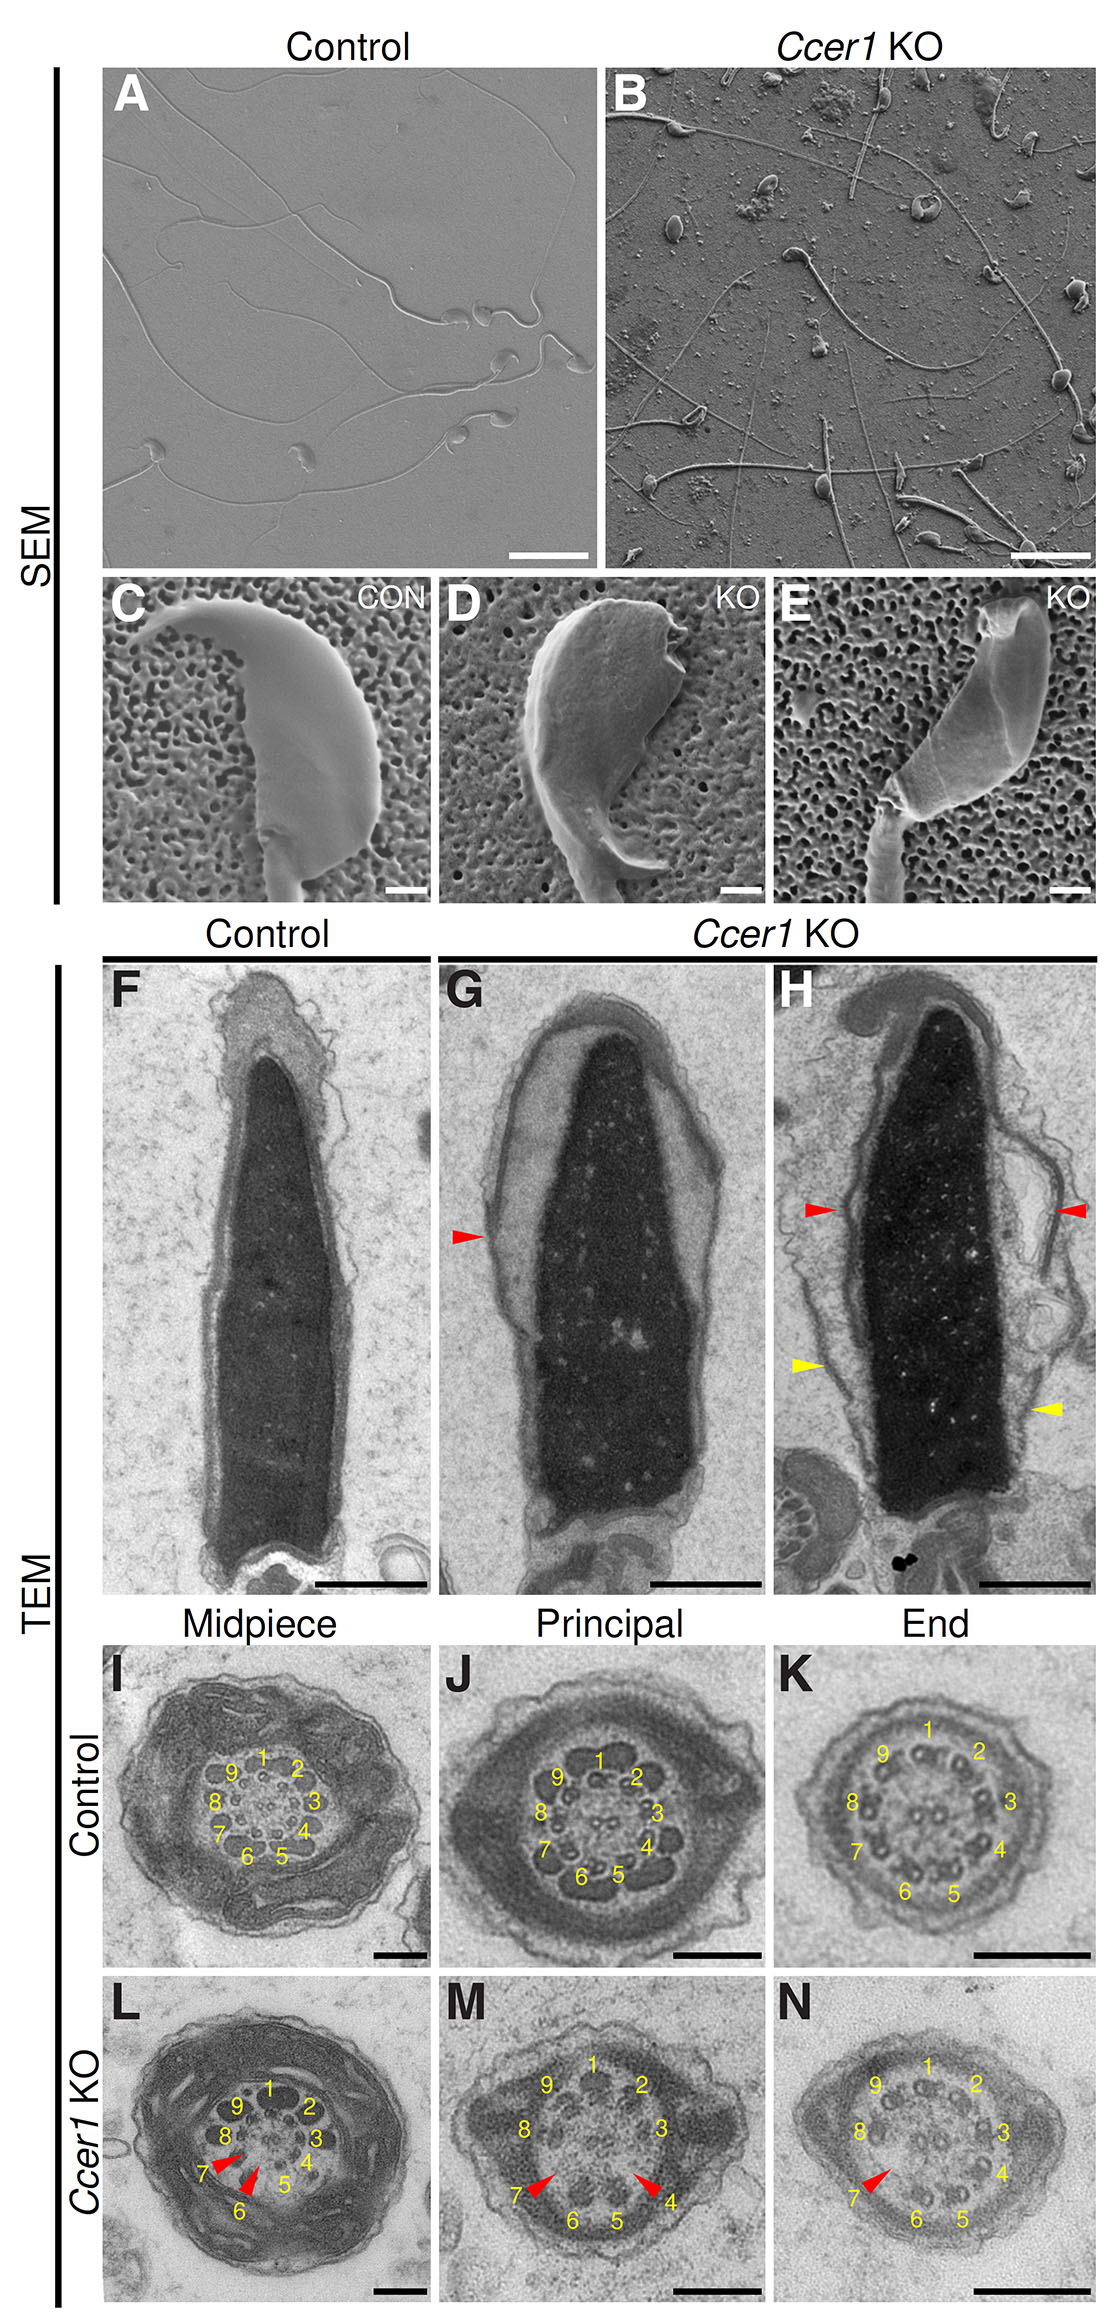
Fig. 4. Ultrastructural analysis of Ccer1 KO epididymal sperm.
(A,B) Scanning electron microscope (SEM) overview micrographs showing control and Ccer1 KO epididymal sperm. (C-E) Zoomed-in SEM micrographs illustrating normal-looking control sperm heads (C) and bent (D) and abnormal (E) sperm heads in Ccer1 KO. (F-H) Transmission electron microscopy (TEM) of epididymal sperm heads of control (F) and Ccer1 KO (G,H) phenotype. Red arrowheads in (G,H) point to detached acrosome and yellow arrowheads to detached calyx. (I-N) TEM analysis of sperm tail morphology in control and Ccer1 KO mice: (I,L) midpiece, (J,M) principal piece, (K,N) end piece. Red arrowheads in (L-N) point to missing microtubule duplets in the Ccer1 KO sperm tail. Scale bar: (A,B) 20 µm; (C-H) 1 µm; (I-N) 200 nm. n = 3 mice/genotype.
To gain a greater understanding of the sperm head defects we used transmission electron microscopy (TEM) to analyze the caudal epididymal sperm head ultrastructure. The control sperm cells showed well-aligned external membranes encapsulating compact nuclei (Fig. 4F), whereas Ccer1 KO sperm cells had disrupted membranes — the acrosomes were detached from the nucleus and calyx (Fig. 4 G,H). Furthermore, the nucleus appeared swollen in Ccer1 KO sperm cells, suggesting DNA compaction issues (Fig. 4 G,H). In association with the observed sperm motility defects, we also analyzed the sperm flagellar ultrastructure. The flagellar cross-sections showed that mitochondrial sheaths in the midpiece, outer dense fibers, and central microtubule singlets located in the center of the cross-sections were indistinguishable in control and Ccer1 KO (Fig. 4 I-N). However, the outer microtubule doublets were frequently missing in Ccer1 KO flagella (Fig. 4 L-N). Overall, Ccer1 deletion causes abnormalities in sperm head and tail morphology, which is in accordance with the above-recorded defects in sperm motility.
Signaling pathways associated with myosin and contractility dominate in Ccer1 KO epididymis
Since our observations showed that the aberrant sperm phenotype was most prominent in the epididymis, we next used epididymal tissue of control and Ccer1 KO mice for RNAseq to determine the global transcriptional profiles. Differentially expressed genes were evaluated using a cutoff of adjusted (adj.) P value 0.0546 (same as the detected Ccer1 adj. P value) and fold change of 1.5. Using these parameters, we identified that 78 genes were significantly upregulated and 11 downregulated in Ccer1 KO epididymis when compared to the controls (Fig. 5A, Table S7).
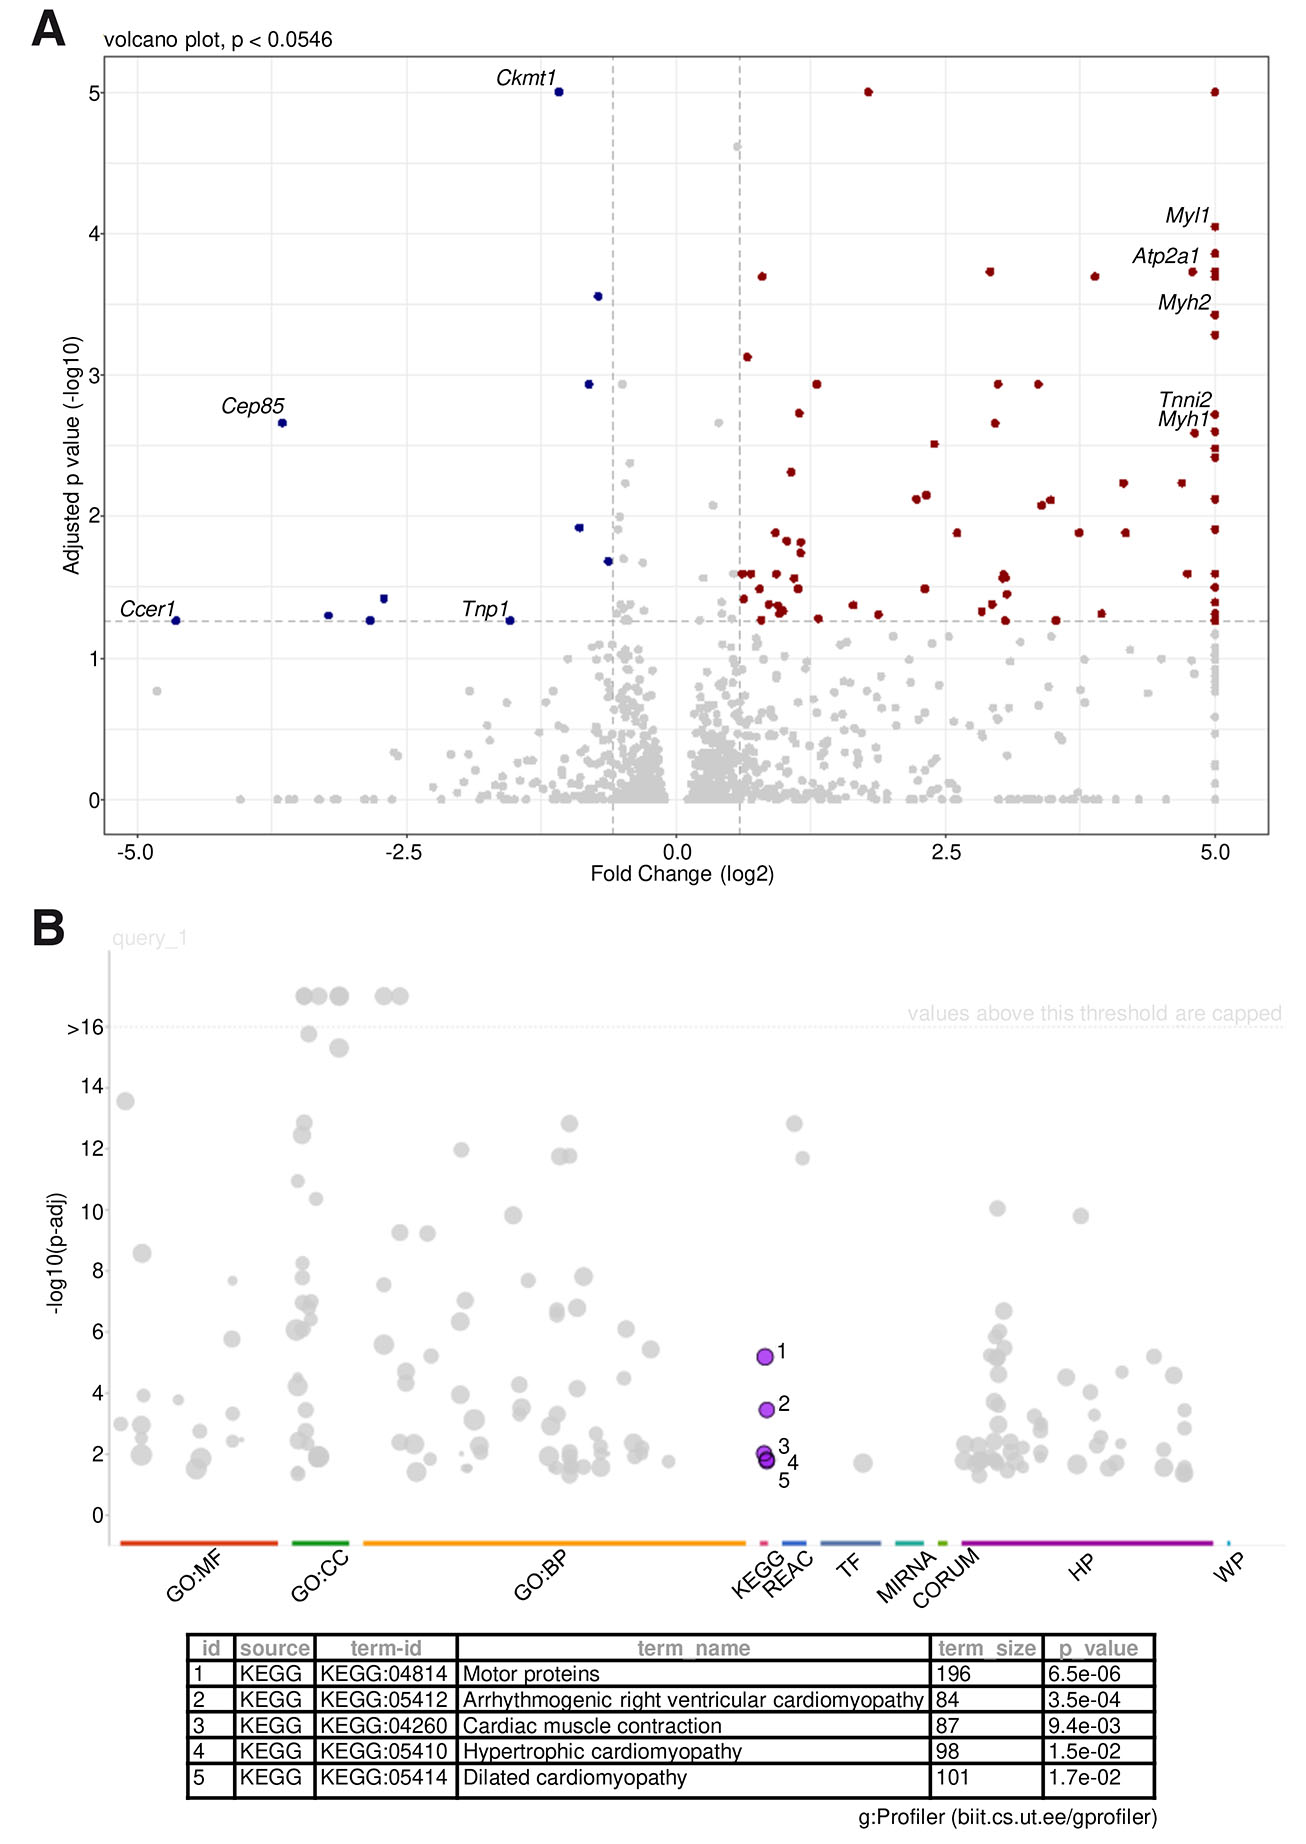
Fig. 5. Differential gene expression analysis in epididymal tissue.
(A) Volcano plots of differentially expressed transcripts determined by RNAseq between Ccer1 KO and control epididymis. Brown, upregulated (fold change > 1.5, adj. P < 0.0546); blue, downregulated (< 1.5, adj. P < 0.0546). Labeled genes depict motor protein (yellow) and muscle (purple) associated genes identified by KEGG analysis. (B) Gene ontology of upregulated genes generated using KEGG. n = 4 mice/genotype.
Gene ontology enrichment for the upregulated genes across multiple databases pointed strongly to motility- and contractility-associated pathways in the case of Ccer1 deletion (Fig. 5B). We chose to illustrate this by KEGG ontologies, which represent complex biological pathways rather than single biological processes (Fig. 5B), and the detailed ontology analysis is available as Table S8. KEGG results pointed to the motor protein cluster (Fig. 5B) consisting of numerous genes encoding myosin constituents, such as the myosin light polypeptides (Myl1), heavy polypeptides (Myh1, Myh2, Myh4) (Stenz et al., 2017; Sun et al., 2018) and troponins (Tnni2, Tnnt3) commonly associated with muscle contractility but also reported in association with sperm function, where contractility is critical to propel motility (Aston et al., 2015; Yang et al., 2023). Four other ontology groups depicted by KEGG (Fig. 5B, Table S8) were closely associated with muscle contractility. These ontology groups were arrhythmogenic right ventricular cardiomyopathy (Atp2a1, Actn2, Actn3, Cacng6, and Cacna1s), cardiac muscle contraction (Atp2a1, Cacng6, Cox8b, and Cacna1s), hypertrophic cardiomyopathy (Atp2a1, Ttn, Cacng6, and Cacna1s), and dilated cardiomyopathy (Atp2a1, Ttn, Cacng6, and Cacna1s). Taken together, Ccer1 deletion in mice leads to changed expression of motility- and contractility-associated genes in the epididymis.
Discussion
Herein we report that Ccer1, a one-exon containing gene coding the CCER1 protein, is critical for spermatogenesis and male fertility. Analysis of the tree of life demonstrated that CCER1 originated in vertebrates and is present already in cartilaginous fish. Although not highly conserved, the protein sequence analysis indicated that CCER1 retained a very similar domain organization between humans and mice, likely due to functional constraints. Its topology strongly suggests a capability to interact with other protein partners, likely via the coiled-coil and disordered binding regions. The phosphorylation sites point towards putative signaling potential or to a possible means of regulating the functional activity of CCER1 itself. Considering the close phylogenetic distances between the species of the analyzed group, the shown data could imply a dynamic adaptation coupled with conservation at key regions. A deeper analysis of the CCER1 evolution would shed more light on the adaptation of the protein; however, such work lies outside the scope of this paper.
The multi-tissue Ccer1 expression analysis pointed out that Ccer1 is a testes-enriched gene starting its expression at P25, a time point when post-meiotic round and elongating spermatids are detected (Janca et al., 1986), and expression continues throughout adulthood. Cell-specific Ccer1 mRNA expression analysis in testes by in situ hybridization showed that gene expression is present in all observed round spermatids (step 1–8) and in step 9 elongating spermatids, representing the first step of the late spermatogenesis stage. Ccer1 expression was low in the epididymis as detected by RT-PCR analysis, suggesting that Ccer1 is highly needed during spermiogenesis, but less so later during sperm cell maturation or upkeeping in the epididymis. This study has defined the Ccer1 gene expression window to coincide with spermatid development and maturation in testes. These data correlate with recently published results by Qin et al., showing CCER1 protein expression in steps 2–10, spanning through the early and beginning of late tubular spermatogenesis stages (Qin et al., 2023). We could not see step 10 spermatids labeled by in situ hybridization, which can be associated with the methodology detecting only mRNA and the timing differences in translation and transcription. All in all, this defines Ccer1 as a specific biomarker for round spermatid mRNA through steps 1–9.
The generated Ccer1 KO mouse model showed that due to gene deletion male mice had significantly fewer offspring indicating a critical role of Ccer1 in male fecundity despite seemingly normal mating behavior. The litter sizes of Ccer1 KO males were almost 50% smaller, and they had five times fewer pups born per detected mating plug. We recorded a striking fertility decrease in Ccer1 KO males, whereas the recent study by Qin et al., reported that Ccer1 KO males were infertile (Qin et al., 2023). The difference in fertility between the two studies might stem from different mouse background strains used in the studies. We used the C57BL/6N and B6D2 strains yielding a subfertile phenotype in Ccer1 KOs while Qin et al., used the C57BL/6J strain and reported an infertile phenotype (Qin et al., 2023). The variable fertility outcomes in the same gene knockouts in association with mouse strains are not uncommon and have been reported earlier (Tam and Cheung, 2020; Vasudevan et al., 2010).
Studies show that spermiogenesis impairment at different steps results in distinct phenotypes (Yan, 2009). In cases when it is impaired during early development (steps 1–8), the round spermatids undergo apoptosis, detach from the Sertoli cells, and can be found in the epididymis, which does not normally happen (Toyama et al., 1999). This leads to reduced testis size. Contrarily, in cases when specific proteins needed for late spermiogenesis (steps 9–16) are impaired, testis size, gross morphology, and sperm counts are often not changed (Yan, 2009). Upon Ccer1 deletion, testis size was not changed despite of the observed expression of the Ccer1 gene through the spermiogenesis, but likely due to the fact that Ccer1 expression extends beyond the early spermatid steps (gene steps 1–9, protein 2–10) and mature sperm still forms it does not follow the canonical phenotype, and testes size remains unchanged.
The examination of epididymal sperm showed an abnormal sperm head phenotype where bent head sperm defects prevailed. Closer ultrastructural analysis showed swollen sperm nuclei, a phenotype that often is associated with aberrant chromosome condensation which in multiple studies has been correlated with the abnormal and bent sperm head phenotypes in mice (du Plessis and Soley, 2011; Zhuang et al., 2014), and human (Guthauser et al., 2011). Chromatin condensation takes place during the round and early elongating spermatid stages, the time when Ccer1 is expressed in testes. Sperm chromatin compaction is required to reduce the nuclear volume and facilitate the development of a small nucleus that will support sperm motility. The abnormal and especially bent sperm phenotype is not obvious in Ccer1 KO testicular sperm but becomes evident during the transition and storage in the epididymis. Sperm motility analysis showed that the counts of motile cells were significantly decreased in Ccer1 KOs both before and after capacitation. Furthermore, parameters associated with sperm velocity were strikingly affected in association with Ccer1 deletion, pointing to critical defects and issues in navigation through the female reproductive track to reach the oocyte.
Ultrastructural analysis by SEM highlighted the abnormal sperm head phenotypes and confirmed an abundance of sperm with bent heads, and TEM allowed us in detail to identify the ultrastructural alterations associated with the sperm phenotype upon Ccer1 deletion. The acrosome and acrosomal cap were detached from the nucleus and appeared swollen, suggesting DNA compaction issues associated with the bent sperm head phenotype also observed in the cases of Dcaf17, Chd5, or Kpna4 deletion (Ali et al., 2018; Miyamoto et al., 2020; Zhuang et al., 2014). Moreover, a closer examination of Ccer1 KO sperm tail morphology showed an accumulation of sperm cells with missing microtubules at different parts of the flagellum. The occurrence of the abnormal head and flagellum phenotypes can be associated with the Ccer1 expression timing in early round spermatids (steps 1–9) when nuclear compaction and tail formation take place (Hermo et al., 2010; Kleene, 1996; O’Donnell, 2014).
Ccer1 deletion in mice was associated with a subfertility phenotype indicating that some sperm cells were maturing and capable of fertilizing an oocyte in a natural mating setup. We performed RNAseq studies of Ccer1 KO epididymis to characterize the nature of the defects in the formed spermatozoa. Several sperm-specific genes were significantly upregulated and downregulated and KEGG ontology analysis pointed to genes that are regarded as molecular motors or needed for muscle contractility. Many of the up- and down-regulated genes detected by RNAseq are known to have expression and function in the sperm flagellum, but at the same time they can be associated with epididymal cell function. Given this, no specific follow-up studies were performed.
CCER1 is an intrinsically disordered protein, and such proteins have been shown to have liquid–liquid phase separation properties (Shin and Brangwynne, 2017). Liquid–liquid phase separation is a physical process facilitating the spontaneous separation of a supersaturated liquid mixture into stable, distinct, coexisting liquid phases (Alavattam et al., 2022; Shin and Brangwynne, 2017; Xu and Qiao, 2021). In the nucleus, phase separation drives the organization of fundamental structures such as nucleoli (Brangwynne et al., 2011), heterochromatin (Larson et al., 2017; Strom et al., 2017), and transcription hubs associated with super-enhancers (Sabari et al., 2018). Accumulating evidence suggests that meiotic sex chromosome inactivation and subsequent sex body formation might be facilitated by phase separation (Alavattam et al., 2022; Xu and Qiao, 2021). Studies show that genes expressed in spermatids are highly enriched on the X chromosome encapsulated by the sex body during meiotic prophase, suggesting that they are escaping meiotic sex chromosome inactivation (Sin et al., 2015). Following these notions and the observation that CCER1 forms droplet-like assemblies in step 9–10 spermatids (Qin et al., 2023) we hypothesize that CCER1 might provide the microenvironment for the transcription and translation of delayed translation proteins in an otherwise transcriptionally silenced spermatid environment. However, proof of this hypothesis will require more detailed experimental evidence.
Taken together, we show that Ccer1 is a round and early elongating spermatid (step 9) specific gene critical for spermiogenesis. Ccer1 gene deletion leads to morphological and functional defects in the sperm head and flagellum and compromises male fertility in mice.
Materials and methods
Protein sequence characterization
CCER1 domains, motifs, and sites listed at UniProt and NCBI GenPept were obtained for human (Q8TC90, NP_689851.1) and mouse (Q9CQL2, NP_080000.1). Orthologs were obtained by query via BLAST (http://blast.ncbi.nlm.nih.gov/Blast.cgi) (Altschul et al., 1990). Additionally, sequence analyses were performed by SMART (Letunic et al., 2021), ELM (Kumar et al., 2022a), NetPhos (Blom et al., 2004) and AIUPred (Erdős and Dosztányi, 2024). Protein features were combined and analyzed by ProToDeviseR (Petrov and Izzi, 2024), with custom cutoff values for NetPhos (>0.95) and AIUPred (> 0.6). Sequence similarity between human and mouse was estimated by SIM (Huang and Miller, 1991) and visualized by Lalnview (Duret et al., 1996).
Sequence alignments and phylogenetic tree
NCBI lists one CCER1 isoform in humans (NP_689851.1), and orthologues in primates were identified by a protein BLAST search against taxid 9443. The hit with the best BLAST score for each species was collected, obtaining 33 sequences (Table S1). Multiple sequence alignments (MSA) were created by PRANK v170427 (Löytynoja, 2021) and the corresponding coding DNA sequences (CDS) were codon-aligned by pal2nal v14.1 (Suyama et al., 2006). The quality of the MSA by columns was estimated by Gblocks (Castresana, 2000). The codon alignments were used for the subsequent analyses with an independent species tree obtained from the TimeTree knowledge-base (Kumar et al., 2022b).
Methods for detecting selection on sites were MEME (Murrell et al., 2012), FUBAR (Murrell et al., 2013), and SLAC (Kosakovsky Pond and Frost, 2005) from HyPhy v2.5.62 (Kosakovsky Pond et al., 2005) and CodeML from PAML v4.10.6 (Yang, 2007). CodeML nested models M7/M8 and M8A/M8 were compared (2ΔL) and the pchisq function in R v4.4.0 (https://www.r-project.org) was used to calculate the likelihood of rejecting the null hypothesis. Both neutral models were rejected in favor of the model for positive selection (M8). Sites inferred to be under selection with default cutoff values: p < 0.1 or Bayes > 0.9, depending on the method, were plotted onto the protein topology of CCER1 from humans. ModelFree from CodeML was used to estimate branches length and selection on branches, which was rendered in color code by Phytools v2.1.1 (Revell, 2024) package for R.
Knockout animal generation and maintenance
The Ccer1 KO mice were generated using the CRISPR/Cas9 technology as described previously (Abbasi et al., 2018). The gRNAs with the lowest amounts of off‐target sites were designed with an online software CRISPRdirect (Naito et al., 2015). The gRNA sequences are shown in Table S9. The KO animal line was maintained in the C57BL/6N and B6D2 hybrid genetic background and genotyped using primers shown in Table S9. Frozen sperm of Ccer1 KO mice will be made available at the RIKEN BioResource Research Center and the Center for Animal Resources and Development (CARD), Kumamoto University. Animal handling was conducted in accordance with Animal Care and Use Committee of the Research Institute for Microbial Diseases, Osaka University, Japan (#Biken-AP-H30-01 and #Biken-AP-R03-01) and Oulu Laboratory Animal Center (OULAC; University of Oulu, Oulu, Finland) and Finnish institutional animal care policies, which fully align with the European Union Directive 2010/63/EU and European Convention for the protection of vertebrate animals used for experimental and other scientific purposes (ETS No. 123, appendix A). All mice were group-housed in specific-pathogen free conditions in individually ventilated cages under controlled environmental conditions (20-26 ⁰C, 40-60% humidity, 12 h light/12 h dark) and had access to standard pellet food and water ad libitum. Wild-type (WT) and Ccer1 heterozygous (HET) mice were used as controls (CON). The mice were at least 8 weeks old when used in experiments.
Fertility testing
The fertility testing was done as described earlier (Kazi et al., 2022; Oura et al., 2020). Briefly, continued matings were set for at least three months with an adult (minimum 8 weeks of age) control or Ccer1 KO male mouse and two or three WT females. The copulation was confirmed by checking for vaginal plugs and the number of pups and litters was recorded.
Histological analyses
Tissues were fixed in Bouin’s Fixative (16045, Polysciences), embedded in paraffin, and sectioned. The sections were stained with the standard periodic acid-Schiff (PAS) method and imaged by using Hamamatsu NanoZoomer S60 Slide Scanner. Alternatively, 4% paraformaldehyde (PFA)-fixed sections were stained with wheat germ agglutinin (WGA) conjugated to Alexa Fluor 594 (Invitrogen, W11262, concentration 2 μg/mL) to visualize acrosomes and with DAPI (Invitrogen, D3571) to dye nuclei. The specimens were mounted with Immu-Mount (Fisher Scientific), and imaged by confocal microscopy (LSM700, Zeiss).
Epididymal and testicular sperm spreads were fixed in 1% PFA and stained with PAS staining. The specimens were mounted with Immu-Mount and imaged with Zeiss Axio Imager M2m light microscope using a Plan-Apochromat 100x/1.40 oil objective and Zeiss Axiocam 506 color camera.
In situ hybridization
RNA antisense probes were generated using a pBluescript II SK (+) vector containing an 812 bp long mouse Ccer1 gene fragment as a template by linearizing it with HindIII restriction enzyme (see plasmid cloning primers in Table S9). 1 µg of linearized plasmid was used for transcribing DIG-labeled RNA probes with T3 polymerase (Promega) and a DIG-RNA labeling mix (Roche), and the probes were dissolved in 90 µl of 50% ultrapure formamide and verified for correct length with agarose gel electrophoresis.
The semi-automated BioLaneTM HTI (Hölle and Hüttner) robotic system was used for washing and incubation steps on the first day, followed by manual processing on the second day. All steps during the first day were carefully carried out using only RNase-free solutions and equipment. On the first day, 5 µm thick, PFA-fixed, paraffin-embedded tissue sections were deparaffinized with xylene and treated with 4% PFA for 20 min, 200 mM HCl for 10 min, and 0.5% acetic anhydride in 100 mM Tris buffer (pH 8.0) for 10 min. Between treatments they were washed multiple times with 1× Tris-buffered saline (1×TBS, pH 7.5). Sections were then permeabilized with 14 µg/mL proteinase K in 20 mM CaCl2 for 10 min at +37°C followed by 1×TBS washes at +4°C and stepwise dehydration to absolute ethanol. Sections were prehybridized in hybridization buffer (0.1 g/mL dextran sulfate, 100 µg/mL ssDNA, 0.02% sodium dodecyl sulfate (SDS), and 50% deionized formamide in 2× saline-sodium citrate (SSC) buffer, pH 4.5) for 30 min at +55°C followed by hybridization overnight at +65°C in a moist chamber in hybridization buffer, which was supplemented with RNA probe diluted 1:75 and heated for 2 min at +85°C prior to application. On the next day, sections were washed twice for 20 min in 2×SSC–50% formamide at +55°C followed by two 15 min washes in 1×SSC at room temperature and a short rinse in 1×TBS. Sections were blocked in blocking solution containing 100 mM maleic acid, 150 mM NaCl, and 2% nucleic acid blocking reagent (Roche) supplemented with 10% heat-inactivated sheep serum for 15 min at room temperature followed by incubation for 3 h at room temperature in blocking solution supplemented with 0.5% sheep serum and alkaline phosphatase (AP)–conjugated anti-DIG antibody (Fab fragments, 11093274910, Roche) diluted 1:700. Sections were briefly washed in 100 mM NaCl–100 mM Tris (pH 9.5) buffer supplemented with 1.5 mM Levamisole (Sigma-Aldrich) and then placed in fresh 100 mM NaCl–100 mM Tris buffer containing 20 µl/mL NBT/BCIP (Roche) for color development for about 16 h (2 h at room temperature followed by 14 h at +4°C). Samples were post-fixed in 4% PFA for 10 min at room temperature, mounted with Immu-Mount (Fisher Scientific), and overview-imaged using Hamamatsu NanoZoomer S60 Slide Scanner with 40× magnification (Fig. S4). Afterwards, the coverslips were detached by overnight incubation in 1× phosphate-buffered saline (PBS) supplemented with 0.1% Triton X-100, and the sections were stained with DAPI (Invitrogen, D3571), mounted with Immu-Mount, and imaged by Leica Stellaris 8 DIVE multiphoton confocal microscope using HC PL APO 63x/1.40 OIL CS2 objective (Fig. 2 C-E’).
Reverse transcription polymerase chain reaction (RT-PCR) and real-time quantitative polymerase chain reaction (RT-qPCR)
Snap-frozen tissue was used for RNA extraction using the RNeasy Mini kit (Qiagen) including DNase I treatment, and 0.8 µg of RNA was transcribed into cDNA by using the First Strand cDNA Synthesis Kit (Thermo Fisher Scientific). cDNA was directly used for RT-PCR or diluted and used to perform RT-qPCR. RT-qPCR analysis was carried out on a CFX96 Real-Time System (Bio-Rad). The primer sequences are available in Table S9. The thermal cycling program consisted of 40 cycles, with an amplification at 95°C for 30 s and 60°C for 1 min. Tissues from three different animals with duplicates were used per each experiment. Gapdh was used as a housekeeping gene for normalization by the 2−ΔΔCT method (Livak and Schmittgen, 2001).
Sperm motility analysis
Cauda sperm was extracted from control and Ccer1 KO littermates and incubated for 10 min and 120 min in TYH medium (Muro et al., 2016) at 37°C, 5% CO2 (capacitating conditions). Diluted sperm samples were imaged and analyzed using the CEROS II sperm analysis system (software version 1.5.2; Hamilton Throne Biosciences, Beverly, MA) as described previously (Miyata et al., 2021).
Scanning Electron Microscopy (SEM)
Epididymal sperm was extracted from control and Ccer1 KO mice to 1×PBS buffer. Diluted samples were loaded on a 0.1 µm pore filter membrane (Millipore) and liquid was removed by using a vacuum pump. The fresh sperm samples were covered with SSE Nanosuit solution (Takaku et al., 2017) and imaged with a Sigma HD-VP field-emission scanning electron microscope (Carl Zeiss).
Transmission Electron Microscopy (TEM)
TEM specimen preparation and microscopy were done as described earlier in Oura et al., (Oura et al., 2020). Briefly, cauda epididymis samples were pre-fixed (1% glutaraldehyde/4% PFA in 0.1 M phosphate buffer, pH 7.4) and then post-fixed (1% OsO4), followed by dehydration in acetone and embedding. Regions of interest were selected, and 80 nm thin sections were post-stained (uranyl acetate & lead citrate) and examined by using Tecnai GS Spirit microscope (FEI Europe, Eindhoven, Netherlands), and images were acquired with Quemesa CCD camera controlled by the iTEM software (Olympus Soft Imaging Solutions GmbH, Munster, Germany).
RNA sequencing and transcriptome analysis
RNA was extracted from snap-frozen epididymis of adult mice with TRIzol and the Direct-zol RNA extraction kit (Zymo). Purified RNA was submitted to Novogene Europe for further processing. Shortly, magnetic beads with poly-T oligos were used to purify mRNA out of the total RNA, followed by fragmentation. Random hexamer primers were used to synthesize first strand cDNA, followed by the second strand cDNA synthesis using dUTP or dTTP for directional or non-directional libraries, respectively. Libraries were checked with Qubit and real-time PCR. Sequencing (>20 million reads per sample) was performed by Novogene Europe on the Illumina NovaSeq 6000 platform. Quality control was performed by filtering raw reads, removing adapter containing reads, removing reads with more than 10% of the base that could not be determined (N > 10%), and removing low quality reads. HISAT2 v2.0.5 was used for mapping the clean reads to the mouse reference genome. For the quantification feature Counts v1.5.0-p3 was used. The expected fragment number per kilobase of transcript sequence per millions base pair sequenced (FPKM) was calculated to evaluate expression levels. The DESeq2 R package (1.20.0) was used to analyze differential expressions and the Benjamini and Hochberg’s method was used to adjust P values. P values ≤ 0.05 were classified as differentially expressed. The adjusted P value of 0.0546 equal to the detected Ccer1 was used as a cutoff for the analysis with fold change 1.5. Raw RNA seq data files are available at https://doi.org/10.5281/zenodo.14697811. Gene ontology enrichment for differentially expressed genes was performed using gprofiler2 (Kolberg et al., 2020). Open access data from The Human Protein Atlas (Karlsson et al., 2021) were downloaded from https://www.proteinatlas.org/about/download (Protein Atlas version 23.0).
Statistical analysis
Two-tailed Student's t-test (*P ≤0.05, **P ≤0.01, ***P ≤0.001, ****P ≤0.0001) by GraphPad Prism 9.5.1 (GraphPad, San Diego, CA, USA) was used for statistical analysis. Data represents the mean ± standard deviation (±SD). At least three mice of each genotype were used in each experiment (the exact n number is provided in the corresponding figure legends), and experiments were reproduced at least three times.
Supplementary Material
Acknowledgements
We thank Oulu Laboratory Animal Center Research Infrastructure, University of Oulu, together with Biocenter Oulu Transgenic and Tissue Phenotyping Core Facility (a member of Infrafrontier-EMMA), Biocenter Oulu Electron Microscopy Core Facility, and Biocenter Oulu Light Microscopy Core Facility, the core facilities being endowed by the University of Oulu and Biocenter Finland, for providing expert services and resources to support this work. We thank Teemu Lappalainen, Tapio Rautio, Fawn Hoffman, Kati Holappa, Teemu Porola, Célia Tebbakh, and Eri Hosoyamada for technical assistance.
Declarations
Funding
This work was supported by grants from the Sigrid Jusélius Foundation to R.P.-H.; the University of Oulu and the Research Council of Finland Profi6 program (AF 336449) to R.P.-H. and E.K; Biocenter Oulu Emerging Project Funding to B.S; Health and Bioscience doctoral program of the University of Oulu to S.K.; Ministry of Education, Culture, Sports, Science, and Technology (MEXT)/Japan Society for the Promotion of Science (JSPS) KAKENHI grants (JP21H05033) to M.I.
Data availability
All relevant data can be found within the article and its supplementary information.
Conflicts of interest
The authors declare they have no competing interests.
Author contributions
Conceptualization: HM, MI, RP-H. Data Curation: BS, PP, VI, RP-H. Formal Analysis: BS, HM, PS, SK, A-LH, PP, VI. Funding Acquisition: MI, RP-H. Investigation: BS, HM, PS, A-LH, PP, IM, VI, MI, RP-H. Methodology: BS, HM, EK, PP, IM, VI. Project Administration: HM, MI, RP-H. Resources: MI, RP-H. Supervision: HM, MI, RP-H. Validation: BS, HM, PS, SK, A-LH, PP, VI, MI, RP-H. Visualization: BS, HM, PS, A-LH, PP, VI. Writing Original Draft: BS, HM, PS, SK, PP, EK, VI, MI, RP-H.
References
Abbasi F., Miyata H., Shimada K., Morohoshi A., Nozawa K., Matsumura T., Xu Z., Pratiwi P., Ikawa M. (2018). RSPH6A is required for sperm flagellum formation and male fertility in mice. Journal of Cell Science 131: jcs221648.
Alavattam K. G., Maezawa S., Andreassen P. R., Namekawa S. H. (2022). Meiotic sex chromosome inactivation and the XY body: a phase separation hypothesis. Cellular and Molecular Life Sciences 79: 18.
Ali A., Mistry B. V., Ahmed H. A., Abdulla R., Amer H. A., Prince A., Alazami A. M., Alkuraya F. S., Assiri A. (2018). Deletion of DDB1- and CUL4- associated factor-17 (Dcaf17) gene causes spermatogenesis defects and male infertility in mice. Scientific Reports 8: 9202.
Altschul S. F., Gish W., Miller W., Myers E. W., Lipman D. J. (1990). Basic local alignment search tool. Journal of Molecular Biology 215: 403-410.
Aston K. I., Uren P. J., Jenkins T. G., Horsager A., Cairns B. R., Smith A. D., Carrell D. T. (2015). Aberrant sperm DNA methylation predicts male fertility status and embryo quality. Fertility and Sterility 104: 1388-1397.e5.
Blom N., Sicheritz‐Pontén T., Gupta R., Gammeltoft S., Brunak S. (2004). Prediction of post‐translational glycosylation and phosphorylation of proteins from the amino acid sequence. Proteomics 4: 1633-1649.
Brangwynne C. P., Mitchison T. J., Hyman A. A. (2011). Active liquid-like behavior of nucleoli determines their size and shape in Xenopus laevis oocytes. Proceedings of the National Academy of Sciences 108: 4334-4339.
Braun R. E. (1998). Post–transcriptional control of gene expression during spermatogenesis. Seminars in Cell & Developmental Biology 9: 483-489.
Castresana J. (2000). Selection of Conserved Blocks from Multiple Alignments for Their Use in Phylogenetic Analysis. Molecular Biology and Evolution 17: 540-552.
Djureinovic D., Fagerberg L., Hallström B., Danielsson A., Lindskog C., Uhlén M., Pontén F. (2014). The human testis-specific proteome defined by transcriptomics and antibody-based profiling. Molecular human reproduction 20: 476-488.
du Plessis L., Soley J.T. (2011). Head-base bending and disjointed spermatozoa in the emu (Dromaius novaehollandiae): A morphological comparison of two closely related defects. Theriogenology 76: 1275-1283.
Duret L., Gasteiger E., Perrièe G. (1996). LALNVIEW: a graphical viewer for pairwise sequence alignments. Bioinformatics 12: 507-510.
Eddy E. M., Toshimori K., O'Brien D. A. (2003). Fibrous sheath of mammalian spermatozoa. Microscopy Research and Technique 61: 103-115.
Erdős G., Dosztányi Z. (2024). AIUPred: combining energy estimation with deep learning for the enhanced prediction of protein disorder. Nucleic Acids Research 52: W176-W181.
Ernst C., Eling N., Martinez-Jimenez C. P., Marioni J. C., Odom D. T. (2019). Staged developmental mapping and X chromosome transcriptional dynamics during mouse spermatogenesis. Nature Communications 10: 1251.
Escalier D. (2006). Knockout mouse models of sperm flagellum anomalies. Human Reproduction Update 12: 449-461.
Guthauser B., Albert M., Ferfouri F., Ray P.F., Rabiey G., Selva J., Vialard F. (2011). Inverse correlation between chromatin condensation and sperm head size in a case of enlarged sperm heads. Reproductive BioMedicine Online 23: 711-716.
Han C. (2024). Gene expression programs in mammalian spermatogenesis. Development 151: dev202033.
Hermo L., Pelletier R.M., Cyr D. G., Smith C. E. (2010). Surfing the wave, cycle, life history, and genes/proteins expressed by testicular germ cells. Part 2: Changes in spermatid organelles associated with development of spermatozoa. Microscopy Research and Technique 73: 279-319.
Houston B. J., Riera-Escamilla A., Wyrwoll M. J., Salas-Huetos A., Xavier M. J., Nagirnaja L., Friedrich C., Conrad D. F., Aston K. I., Krausz C., Tüttelmann F., O’Bryan M. K., Veltman J. A., Oud M. S. (2022). A systematic review of the validated monogenic causes of human male infertility: 2020 update and a discussion of emerging gene–disease relationships. Human Reproduction Update 28: 15-29.
Huang X., Miller W. (1991). A time-efficient, linear-space local similarity algorithm. Advances in Applied Mathematics 12: 337-357.
Janca F. C., Jost L. K., Evenson D. P. (1986). Mouse Testicular and Sperm Cell Development Characterized from Birth to Adulthood by Dual Parameter Flow Cytometry. Biology of Reproduction 34: 613-623.
Joseph S., Mahale S. D. (2021). Male Infertility Knowledgebase: decoding the genetic and disease landscape. Database : the journal of biological databases and curation 2021: baab049.
Karlsson M., Zhang C., Méar L., Zhong W., Digre A., Katona B., Sjöstedt E., Butler L., Odeberg J., Dusart P., Edfors F., Oksvold P., von Feilitzen K., Zwahlen M., Arif M., Altay O., Li X., Ozcan M., Mardinoglu A., Fagerberg L., Mulder J., Luo Y., Ponten F., Uhlén M., Lindskog C. (2021). A single–cell type transcriptomics map of human tissues. Science Advances 7: eabh2169.
Kazi S., Castañeda J. M., Savolainen A., Xu Y., Liu N., Qiao H., Ramirez‐Solis R., Nozawa K., Yu Z., Matzuk M. M., Prunskaite‐Hyyryläinen R. (2022). MRNIP interacts with sex body chromatin to support meiotic progression, spermatogenesis, and male fertility in mice. The FASEB Journal 36: e22479.
Kleene K. C. (1996). Patterns of translational regulation in the mammalian testis. Molecular Reproduction and Development 43: 268-281.
Kolberg L., Raudvere U., Kuzmin I., Vilo J., Peterson H., (2020). gprofiler2 -- an R package for gene list functional enrichment analysis and namespace conversion toolset g:Profiler. F1000Research 9: ELIXIR-709.
Kosakovsky Pond S. L., Frost S. D. W. (2005). Not So Different After All: A Comparison of Methods for Detecting Amino Acid Sites Under Selection. Molecular Biology and Evolution 22: 1208-1222.
Kosakovsky Pond S. L., Frost S. D. W., Muse S. V. (2005). HyPhy: hypothesis testing using phylogenies. Bioinformatics 21: 676-679.
Kumar M., Michael S., Alvarado-Valverde J., Mészáros B., Sámano-Sánchez H., Zeke A., Dobson L., Lazar T., Örd M., Nagpal A., Farahi N., Käser M., Kraleti R., Davey N. E., Pancsa R., Chemes L. B., Gibson T. J. (2022a). The Eukaryotic Linear Motif resource: 2022 release. Nucleic Acids Research 50: D497-D508.
Kumar S., Suleski M., Craig J. M., Kasprowicz A. E., Sanderford M., Li M., Stecher G., Hedges S. B. (2022b). TimeTree 5: An Expanded Resource for Species Divergence Times. Molecular Biology and Evolution 39: msac174.
Larson A. G., Elnatan D., Keenen M. M., Trnka M. J., Johnston J. B., Burlingame A. L., Agard D. A., Redding S., Narlikar G. J. (2017). Liquid droplet formation by HP1α suggests a role for phase separation in heterochromatin. Nature 547: 236-240.
Letunic I., Khedkar S., Bork P. (2021). SMART: recent updates, new developments and status in 2020. Nucleic Acids Research 49: D458-D460.
Lindemann C. B., Lesich K. A. (2016). Functional anatomy of the mammalian sperm flagellum. Cytoskeleton 73: 652-669.
Livak K. J., Schmittgen T. D. (2001). Analysis of Relative Gene Expression Data Using Real-Time Quantitative PCR and the 2−ΔΔCT Method. Methods 25: 402-408.
Löytynoja A. (2021). Phylogeny-Aware Alignment with PRANK and PAGAN. In Multiple Sequence Alignment. (Ed. Katoh Kazutaka) Springer US, New York, NY.
Meistrich M. L., Hess R. A. (2013). Assessment of Spermatogenesis Through Staging of Seminiferous Tubules. In Spermatogenesis. (Ed. Carrell Douglas T., Aston Kenneth I.) Humana Press, Totowa, NJ.
Miyamoto Y., Sasaki M., Miyata H., Monobe Y., Nagai M., Otani M., Whiley P. A. F., Morohoshi A., Oki S., Matsuda J., Akagi K., Adachi J., Okabe M., Ikawa M., Yoneda Y., Loveland K. L., Oka M. (2020). Genetic loss of importin α4 causes abnormal sperm morphology and impacts on male fertility in mouse. The FASEB Journal 34: 16224-16242.
Miyata H., Oura S., Morohoshi A., Shimada K., Mashiko D., Oyama Y., Kaneda Y., Matsumura T., Abbasi F., Ikawa M. (2021). SPATA33 localizes calcineurin to the mitochondria and regulates sperm motility in mice. Proceedings of the National Academy of Sciences 118: e2106673118.
Miyata H., Shimada K., Kaneda Y., Ikawa M. (2024). Development of functional spermatozoa in mammalian spermiogenesis. Development 151: dev202838.
Muro Y., Hasuwa H., Isotani A., Miyata H., Yamagata K., Ikawa M., Yanagimachi R., Okabe M. (2016). Behavior of Mouse Spermatozoa in the Female Reproductive Tract from Soon after Mating to the Beginning of Fertilization. Biology of Reproduction 94: 80.
Murrell B., Moola S., Mabona A., Weighill T., Sheward D., Kosakovsky Pond S. L., Scheffler K. (2013). FUBAR: A Fast, Unconstrained Bayesian AppRoximation for Inferring Selection. Molecular Biology and Evolution 30: 1196-1205.
Murrell B., Wertheim J. O., Moola S., Weighill T., Scheffler K., Kosakovsky Pond S. L. (2012). Detecting Individual Sites Subject to Episodic Diversifying Selection. PLoS Genetics 8: e1002764.
Naito Y., Hino K., Bono H., Ui-Tei K. (2015). CRISPRdirect: software for designing CRISPR/Cas guide RNA with reduced off-target sites. Bioinformatics 31: 1120-1123.
Nishimura H., L’Hernault S. W. (2017). Spermatogenesis. Current Biology 27: R988-R994.
Njagi P., Groot W., Arsenijevic J., Dyer S., Mburu G., Kiarie J. (2023). Financial costs of assisted reproductive technology for patients in low- and middle-income countries: a systematic review. Human Reproduction Open 2023: hoad007.
O’Donnell L. (2014). Mechanisms of spermiogenesis and spermiation and how they are disturbed. Spermatogenesis 4: e979623.
Okada Y. (2022). Sperm chromatin condensation: epigenetic mechanisms to compact the genome and spatiotemporal regulation from inside and outside the nucleus. Genes & Genetic Systems 97: 41-53.
Oud M. S., Volozonoka L., Smits R. M., Vissers L. E. L. M., Ramos L., Veltman J. A. (2019). A systematic review and standardized clinical validity assessment of male infertility genes. Human Reproduction 34: 932-941.
Oura S., Kazi S., Savolainen A., Nozawa K., Castañeda J., Yu Z., Miyata H., Matzuk R. M., Hansen J. N., Wachten D., Matzuk M. M., Prunskaite-Hyyryläinen R. (2020). Cfap97d1 is important for flagellar axoneme maintenance and male mouse fertility. PLoS Genetics 16: e1008954.
Petrov P. B., Izzi V., (2024). ProToDeviseR: an automated protein topology scheme generator. bioRxiv Preprint: 2024.06.04.597333.
Qin D., Gu Y., Zhang Y., Wang S., Jiang T., Wang Y., Wang C., Chen C., Zhang T., Xu W., Wang H., Zhang K., Hu L., Li L., Xie W., Wu X., Hu Z. (2023). Phase-separated CCER1 coordinates the histone-to-protamine transition and male fertility. Nature Communications 14: 8209.
Ren X., Chen X., Wang Z., Wang D. (2017). Is transcription in sperm stationary or dynamic?. Journal of Reproduction and Development 63: 439-443.
Revell L. J. (2024). phytools 2.0: an updated R ecosystem for phylogenetic comparative methods (and other things). PeerJ 12: e16505.
Sabari B. R., Dall'Agnese A., Boija A., Klein I. A., Coffey E. L., Shrinivas K., Abraham B. J., Hannett N. M., Zamudio A. V., Manteiga J. C., Li C. H., Guo Y. E., Day D. S., Schuijers J., Vasile E., Malik S., Hnisz D., Lee T. I., Cisse I. I., Roeder R. G., ... Young R. A., (2018). Coactivator condensation at super-enhancers links phase separation and gene control. Science 361: eaar3958.
Schultz N., Hamra F. K., Garbers D. L. (2003). A multitude of genes expressed solely in meiotic or postmeiotic spermatogenic cells offers a myriad of contraceptive targets. Proceedings of the National Academy of Sciences 100: 12201-12206.
Shin Y., Brangwynne C. P. (2017). Liquid phase condensation in cell physiology and disease. Science 357: eaaf4382.
Sin H.S., Kartashov A. V., Hasegawa K., Barski A., Namekawa S. H. (2015). Poised chromatin and bivalent domains facilitate the mitosis-to-meiosis transition in the male germline. BMC Biology 13: 53.
Stenz L., Escoffier J., Rahban R., Nef S., Paoloni-Giacobino A., (2017). Testicular Dysgenesis Syndrome and Long-Lasting Epigenetic Silencing of Mouse Sperm Genes Involved in the Reproductive System after Prenatal Exposure to DEHP. PloS one 12: e0170441.
Strom A. R., Emelyanov A. V., Mir M., Fyodorov D. V., Darzacq X., Karpen G. H. (2017). Phase separation drives heterochromatin domain formation. Nature 547: 241-245.
Sun W., Dong H., Becker A. S., Dapito D. H., Modica S., Grandl G., Opitz L., Efthymiou V., Straub L. G., Sarker G., Balaz M., Balazova L., Perdikari A., Kiehlmann E., Bacanovic S., Zellweger C., Peleg-Raibstein D., Pelczar P., Reik W., Burger I. A., von Meyenn F., Wolfrum C. (2018). Cold-induced epigenetic programming of the sperm enhances brown adipose tissue activity in the offspring. Nature Medicine 24: 1372-1383.
Suyama M., Torrents D., Bork P. (2006). PAL2NAL: robust conversion of protein sequence alignments into the corresponding codon alignments. Nucleic Acids Research 34: W609-W612.
Takaku Y., Suzuki H., Kawasaki H., Ohta I., Ishii D., Hirakawa S., Tsutsui T., Matsumoto H., Takehara S., Nakane C., Sakaida K., Suzuki C., Muranaka Y., Kikuchi H., Konno H., Shimomura M., Hariyama T. (2017). A modified ‘NanoSuit®’ preserves wet samples in high vacuum: direct observations on cells and tissues in field-emission scanning electron microscopy. Royal Society Open Science 4: 160887.
Tam W. Y., Cheung K.K. (2020). Phenotypic characteristics of commonly used inbred mouse strains. Journal of Molecular Medicine 98: 1215-1234.
Toyama Y., Maekawa M., Kadomatsu K., Miyauchi T., Muramatsu T., Yuasa S. (1999). Histological Characterization of Defective Spermatogenesis in Mice Lacking the Basigin Gene. Anatomia, Histologia, Embryologia 28: 205-213.
Tüttelmann F., Ruckert C., Röpke A. (2018). Disorders of spermatogenesis. Medizinische Genetik 30: 12-20.
Uhlén M., Fagerberg L., Hallström B. M., Lindskog C., Oksvold P., Mardinoglu A., Sivertsson Å, Kampf C., Sjöstedt E., Asplund A., Olsson I.M., Edlund K., Lundberg E., Navani S., Szigyarto C. A.K., Odeberg J., Djureinovic D., Takanen J. O., Hober S., Alm T., Edqvist P.H., Berling H., Tegel H., Mulder J., Rockberg J., Nilsson P., Schwenk J. M., Hamsten M., von Feilitzen K., Forsberg M., Persson L., Johansson F., Zwahlen M., von Heijne G., Nielsen J., Pontén F. (2015). Tissue-based map of the human proteome. Science 347: 1260419.
Vasudevan K., Raber J., Sztein J. (2010). Fertility comparison between wild type and transgenic mice by in vitro fertilization. Transgenic Research 19: 587-594.
Wu T. F., Chu D. S. (2008). Sperm Chromatin: Fertile Grounds for Proteomic Discovery of Clinical Tools. Molecular & Cellular Proteomics 7: 1876-1886.
Xu Y., Qiao H. (2021). A Hypothesis: Linking Phase Separation to Meiotic Sex Chromosome Inactivation and Sex-Body Formation. Frontiers in Cell and Developmental Biology 9: 674203.
Yan W. (2009). Male infertility caused by spermiogenic defects: Lessons from gene knockouts. Molecular and Cellular Endocrinology 306: 24-32.
Yang Y., Qin S., Wu H., Zhang J., Tian Q., Zhao Z., Wei B., Hallak J., Mao X. (2023). Identification of PDCL2 as a candidate marker in Sertoli cell-only syndrome by chromatin immunoprecipitation-sequencing and bioinformatics analysis. Translational Andrology and Urology 12: 1127-1136.
Yang Z., (2007). PAML 4: phylogenetic analysis by maximum likelihood. Molecular Biology and Evolution 24: 1586-1591.
Zhuang T., Hess R. A., Kolla V., Higashi M., Raabe T. D., Brodeur G. M. (2014). CHD5 is required for spermiogenesis and chromatin condensation. Mechanisms of Development 131: 35-46.